9.1 Risk Calculations
When site-specific RBA values are incorporated into a HHRA (or in the calculation of cleanup goals), several factors must be considered. One of the critical factors is ensuring that the risk estimates are representative of (or cleanup goals are protective of) the reasonable maximum exposure (RME) for a receptor group. This approach is consistent with USEPA and state objectives for risk-based decision-making.
9.1.1 Conceptual Site Model
A conceptual site model (CSM) describes the potential contaminant sources, release mechanisms, fate and transport pathways, affected environmental media, receptors, and exposure pathways relevant to current and potential activities and land uses for a site. The CSM documents current and potential future site conditions and explains the relationship between sources and receptors by considering potential or actual migration and exposure pathways.
9.1.2 USEPA Guidance on Bioavailability Assessment and RBA Values
Bioavailability is identified as a component in estimating the health risk of chemicals in soil in several documents, including RAGS Part A (USEPA 1989b); Soil Screening Guidance (USEPA 1996b); and Supplemental Guidance for Developing Soil Screening Levels for Superfund Sites (USEPA 2002c).
RAGS Part A (USEPA 1989b) indicates that site-specific HHRA may consider bioavailability estimates to account for the difference in absorption efficiencies of a chemical in different media (such as water and soil). In the absence of chemical- and site-specific RBA data, USEPA and state agencies use a default RBA of 100% for chemicals in soil. The use of soil RBA values in HHRA is evaluated in this guidance for the oral ingestion pathway only. Assessing bioavailability in dermal contact exposure to PAHs in soil is briefly discussed.
9.1.3 Incorporating RBA values in the Calculation of Risk Estimates or Cleanup Goals
The use of HHRA and the equations used in evaluating the potential significance of exposure to chemicals are explained in many USEPA and states guidance documents, including ITRC’s RISK-1 and RISK-2 guidance. ITRC’s RISK-3 guidance describes both forward and backward calculations of risk and cleanup goals, respectively.
The forward calculation for the oral exposure route derives a lifetime average daily dose (LADD, for cancer) or average daily dose (ADD, for noncancer) using the concentration of the chemical in soil to which a receptor is exposed over the exposure period (exposure concentration) and default or site-specific exposure assumptions (such as averaging time, exposure duration, exposure frequency, and soil ingestion rate).
Next, the noncancer hazard quotient (HQ) is established using the ratio of the calculated ADD to the appropriate chemical-specific oral reference dose (RfD). The cancer risk (CR) is established by multiplying the LADD by the cancer slope factor (CSF). Individual CR and HQ estimates for each chemical can be summed to form a cumulative CR and noncancer hazard index (HI), respectively. The calculated cumulative CR or HI is then compared to the regulatory acceptable target cancer risk (TCR) level or range (for example, 1×10⁻⁶ to 1×10⁻⁴) or target noncancer hazard index (THI is generally 1) to determine if a site requires additional response activities. Different regulatory programs may have different risk management goals. Likewise, some programs do not account for cumulative risk and rely on evaluating single-chemical risk estimates to make decisions about risk management actions.
In a backward calculation, the screening level or soil cleanup goal for each chemical is derived using predetermined or regulatory acceptable TCR or target hazard quotient (THQ), appropriate toxicity value, and exposure assumptions similar to those used in the forward calculation. Site exposure concentrations (for example, the 95% UCL on the mean) can then be compared to the calculated risk-based screening levels or cleanup goals to evaluate whether a site requires additional response activities.
Lead calculations are performed differently from those presented above; see further discussion in the lead example section below.
9.1.3.1 Appropriate Oral Toxicity Values
The toxicity values used for evaluating exposures to soil by ingestion are the RfD and CSF. RfDs are toxicity endpoints/values used to evaluate potential human noncancer hazard from oral exposure; see ITRC’s RISK-3 guidance (ITRC 2015). CSFs are toxicity endpoints/values used to evaluate potential human carcinogenic risks from oral exposure to carcinogens over a lifetime.
PAH CSF Determination
PAHs have different cancer potencies and are evaluated in HHRAs using a relative potency factor (RPF) approach. RPFs for PAHs describe the cancer potency value of individual PAHs relative to benzo(a)pyrene (BaP). RPFs may be applied to the measured soil concentrations to derive BaP toxicity equivalent concentrations, or the RPF may be applied to the BaP CSF to derive the CSF value for each carcinogenic PAH. Table 8-1 includes the RPF for some carcinogenic PAHs relative to the BaP CSF.
Mutagenic Mode of Action (MMOA)
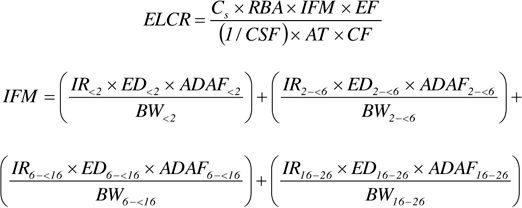
When a chemical is determined to be a carcinogen with a potential MMOA, the CSFs are developed using chemical-specific modifications that address the differential potency caused by critical early life stage exposures (USEPA 2005b). Under USEPA’s (2005a) Guidelines for Carcinogen Risk Assessment, BaP is “carcinogenic to humans.” USEPA also considers BaP to have an MMOA; therefore, carcinogenic PAHs with CSFs based on RPFs applied to the BaP CSF are also considered mutagenic carcinogens (USEPA 2017f). When chemical-specific cancer toxicity data on the critical window of exposure are not available, CSF modifications are made using default adjustment values or age–dependent adjustment factors (ADAF). The USEPA default ADAF values are used when modifying the BaP CSF (USEPA 2005a; 2017f). See example calculations.
9.1.3.2 RBA and the Daily Intake Rate
In the forward risk (or hazard) calculation of the CR (or HQ), the RBA value is used to modify the daily dose of a chemical in soil considering the dosing medium used in the critical study for that chemical that provided the basis for the RfD or CSF value. The bioavailability of a chemical in soil is often lower than the unbound chemical or chemical form in water or diet due to varying chemical and soil properties including solubility, organic characteristics (diffusion and biodegradability), and chemical form (NRC 2003). PAHs are sparingly water soluble and tend to sorb strongly to soil. Modifications to the daily dose of chemicals in soil are therefore necessary when the toxicity value is based on a critical study that used water or food (something other than soil) as a delivery medium for the chemical. The equations below show how RBA is incorporated in the forward risk or hazard calculations:
Cancer risk:
![]()
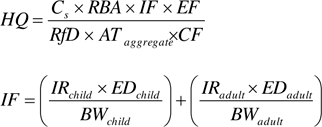
Noncancer hazard:
![]()
Where:
| AT (Averaging time) | = | days (for cancer – 70 years x 365 days/year; for noncancer – ED x 365 days/year) |
| BW (Body weight) | = | kg |
| Cs (Concentration in soil) | = | site-specific, mg/kg |
| CF (Conversion factor) | = | 1.0E+6 mg/kg |
| CSF (Cancer slope factor) | = | chemical-specific, (mg/kg-day)-1 |
| DI (Daily intake) | = | chemical-specific, mg/kg-day |
| ED (Exposure duration) | = | years |
| EF (Exposure frequency) | = | days/year |
| ELCR (Excess Lifetime Cancer risk) | = | unitless |
| HQ (Hazard quotient) | = | unitless |
| IR (Ingestion rate) | = | mg/day |
| RBA (Relative bioavailability) | = | site-specific, unitless |
| RfD (Oral reference dose) | = | chemical-specific, mg/kg-day |
Daily intake is the chemical intake based on body-weight-adjusted chemical concentration in soil for a site scenario that is adjusted to a daily intake rate by the averaging time. The soil exposure concentration is an estimate of the mean (for example, the 95% UCL on the mean), depending on the regulatory requirement and data quality needs.
All equations presented above assume that RBA is constant over the range of doses. However, RBAs vary with factors such as dose, presence of other chemicals, and soil exposure duration. Thus, the assumption that the RBA is a constant is valid only within the conditions under which it was derived.
9.1.3.3 RBA and the Oral Toxicity Values
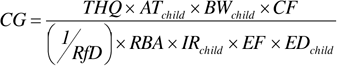
Unlike the forward calculation of risk estimates, in a backward HHRA, the soil risk-based cleanup goals are calculated based on a target cancer risk or target hazard quotient. In this approach, RBA is used to modify the toxicity values (CSF or RfD):
For carcinogens:
![]()
For noncarcinogens:
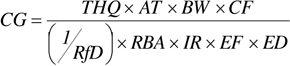
Where:
| AT | (Averaging time) | = | days (for cancer – 70 years x 365 days/year; for noncancer – ED x 365 days/yr) |
| BW | (Body weight) | = | kg |
| CF | (Conversion factor) | = | 1.0E+6 mg/kg |
| CG | (Cleanup goal) | = | chemical-specific, mg/kg |
| CSF | (Cancer slope factor) | = | chemical-specific, (mg/kg-day)-1 |
| ED | (Exposure duration) | = | years |
| EF | (Exposure frequency) | = | days/year |
| IR | (Ingestion rate) | = | mg/day |
| RBA | (Relative bioavailability) | = | site-specific, unitless |
| RfD | (Oral reference dose) | = | chemical-specific, mg/kg-day |
| TCR | (Target cancer risk) | = | unitless |
| THQ | (Target hazard quotient) | = | unitless |
9.1.4 Exposure Assumptions in Relation to Bioavailability
Integration of bioavailability into the risk or hazard (or soil cleanup goal) calculations still represents the RME. For ingestion of contaminants in soil, the RME for chronic exposure combines “an average exposure point concentration with reasonably conservative values for intake and duration in the exposure calculations” (USEPA 1996b).
9.1.5 Use of Default RBA Values
USEPA has established default RBA values that can be used in evaluating the significance of exposures to lead (USEPA 1999) and arsenic (USEPA 2012d) from soil. Despite the availability of these defaults, agencies have advocated the use of site-specific data where possible. Agencies have adopted this position because default RBA values and the scenario they are based on may not be appropriate in some site-specific conditions or circumstances (NRC 2003). Note that when representative and valid site-specific RBA data are available, those data should be used in place of default RBA values in HHRA. This practice reduces uncertainty in the site-specific risk-based decisions.
9.1.6 Determining the Site-Specific RBA for HHRA
The number of samples and sampling approach (for example, discrete or incremental samples) is a site-specific decision requiring professional judgement. Various site-specific aspects should be considered, such as site geology (how many different soil types are present), source areas (whether different source areas are present), exposure areas (whether various exposure areas are present and if some are representative of others), and chemical concentrations. ITRC’s Incremental Sampling Methodology (ISM) guidance (ITRC 2012) and USEPA (2015a) guidance for lead sampling provide further information on considerations during project planning.
9.1.7 RBA Based on Site-Specific Results
At sites where both in vivo method and in vitro method results are available, the project team should consider the quality and quantity of the results and determine whether to use the in vivo or in vitro results, or some combination of the information. If the results are equally representative of site conditions and valid, then typically the in vivo results are preferred over the in vitro results.
The information expected from the laboratory for an in vivo or in vitro study is presented in the Methodology section. Specific information for lead, arsenic, and PAHs is also discussed in each of the chemical-specific chapters.
9.1.8 Examples of RBA Use in HHRA
Exposure is quantified considering the magnitude, frequency, and duration of exposure for the receptors and pathways selected for quantitative HHRA. The exposure factors used in the example risk calculations below are based on the latest USEPA Office of Land and Emergency Management (OLEM), formerly Office of Solid Waste and Emergency Response (OSWER), (USEPA 2014a) and Regional Screening Level guidance. The RfD and CSF values are from the Integrated Risk Information System (IRIS) database (USEPA 2015b). USEPA and many states use the OSWER guidance and IRIS database values to calculate risk estimates and screening levels (USEPA 2017h).
The following sections use hypothetical example site data to illustrate the HHRA calculations for arsenic and BaP. When considering these examples in the context of a specific site, applicable requirements and regulations, and method limitations should be considered.
9.1.8.1 Arsenic Example Calculations ▼Read more
9.1.8.2 Benzo(a)Pyrene (BaP) Example Calculations ▼Read more
9.1.9 Lead
USEPA guidance addresses soil sampling for IVBA testing for lead, stating that lead RBA estimates are used in lead risk assessment models (USEPA 2015a).
9.1.9.1 Lead Models
Various lead models can help to evaluate lead exposures.
9.1.9.2 Lead Example Calculations ▼Read more
9.1.10 Applicability to Other Chemicals
This guidance focuses on lead, arsenic, and PAHs. Other chemicals may be of interest at a site. When applying the risk assessment and cleanup goal calculations described in this section to other chemicals, note the following:
Other inorganics (for example, cadmium, cobalt, nickel). ▼Read more
Petroleum hydrocarbons. ▼Read more
Dioxins and Furans. ▼Read more

