• Skip to main content
itrc_logo

Bioavailability of Contaminants in Soil: Considerations for Human Health Risk Assessment

Navigating this Website
1 Introduction
1 Introduction Overview
1.1 Using Bioavailability Information
1.2 Background
1.3 Definition of Terms
2 Regulatory Background
2 Regulatory Background Overview
2.1 Current Practices: Survey of State Regulators
3 Technical Background
3 Technical Background Overview
3.1 Soil Mineral Phases
3.2 Soil pH, Organic Matter, and Reactive Clay Minerals
3.3 Soil Particle Size
4 Decision Process
4 Decision Process Overview
4.1 Decision Process Flowchart
4.2 Is there a Method Available?
4.3 Could Bioavailability Assessment Affect the Remedial Decisions?
4.4 Do the Benefits of Bioavailability Assessment Justify the Costs?
4.5 Further Considerations
5 Methodology
5 Methodology for Evaluating Contaminant Oral Bioavailability Overview
5.1 In Vivo Approach
5.2 In Vitro Approach
6 Lead
6 Lead Overview
6.1 Fate and Transport
6.2 Toxicology and Exposure
6.3 Methodology for Quantifying RBA of Lead in Soil
6.4 When Does a Bioavailability Study Make Sense?
6.5 Case Studies
6.6 Using Bioavailability Methods to Evaluate Remedies (Bioavailability-Based Remediation)
7 Arsenic
7 Arsenic Overview
7.1 Fate and Transport
7.2 Toxicology and Exposure
7.3 Methodology for Evaluating Arsenic Bioavailability
7.4 When Does It Make Sense to Use Bioavailability?
7.5 Case Studies
7.6 Using Bioavailability Methods to Evaluate Remedies (Bioavailability Based Remediation)
8 PAHs
8 Polycyclic Aromatic Hydrocarbons (PAHs) Overview
8.1 PAH Sources and Exposure
8.2 General Toxicity of PAHs
8.3 Influences of Soil on Bioavailability of PAH
8.4 Methodology for Evaluating PAH Bioavailability
8.5 Dermal Absorption
8.6 Amendment Strategies and Permanence of Bioavailability
8.7 Case Study
9 Risk Assessment
9 Using Bioavailability Information in Risk Assessment Overview
9.1 Risk Calculations
9.2 Other Considerations and Limitations
10 Stakeholder Perspectives
10 Stakeholder Perspectives Overview
10.1 Stakeholder Concerns
10.2 Specific Tribal Stakeholder Concerns
10.3 Stakeholder Engagement
11 Case Studies
11 Case Studies Overview
11.1 Arsenic, Mining, CA
11.2 Arsenic, Pesticide, AR
11.3 Arsenic, Naturally occurring, UT
11.4 Arsenic, Smelter, AZ
11.5 Arsenic-contaminated tailings, OR
11.6 Lead, Industrial, Midwest US
11.7 PAH, Skeet targets, TX
11.8 Arsenic, Copper precipitation, UT
11.9 Arsenic, CCA wood preservative, CA
11.10 Arsenic, MGP coal ash, MI
11.11 Lead, Mining MT
11.12 Lead, Mining, MT
11.13 Lead, Smelter, UT
Additional Information
Review Checklist
Appendix A: Detailed Survey Responses
Appendix B: Chemical Reactions of Metals
Acronyms
Glossary
Acknowledgments
Team Contacts
Document Feedback


Bioavailability of Contaminants in Soil
HOME

11.11 Barker Hughesville Mining District Superfund Site, Cascade/Judith Basin County, Montana

Contact: Lynn Woodbury
Organization: CDM Smith
Email: [email protected]

11.11.1 Site Description and Conceptual Site Model

The Barker Hughesville Mining District Superfund site is in the Little Belt Mountains in west-central Montana, about 40 miles southeast of Great Falls and about 10 to 12 miles east of the town of Monarch.

Detailed information on the site is presented in the Remedial Investigation report (USEPA 2016g). In brief, the site is renowned for its rich mining legacy and prospered through the later part of the 19th and early 20th century. Silver and lead were discovered in the Galena Creek drainage in 1879, and by the next year the area had several hundred claims. Silver and lead mining boomed in the 1880s and 1920s, and continued sporadically into the 1940s. Historical mining camps in Barker and Hughesville, located along Galena Creek, were home to miners who worked at nearby mines and ore processing facilities. A smelter near Barker operated from 1881 to 1883. Mining tapered off around 1883, after the depletion of surficial ore bodies. Operations resumed upon completion of a rail line between the site and the Great Northern Line in Monarch, with periods of increased activity in the 1920s and early 1940s. Large-scale mining in the area ended in 1943 when all operations ceased. This area contains approximately 46 abandoned mines strewn with waste rock dumps, tailings, and seeping mine adits (see Figure 11-12).

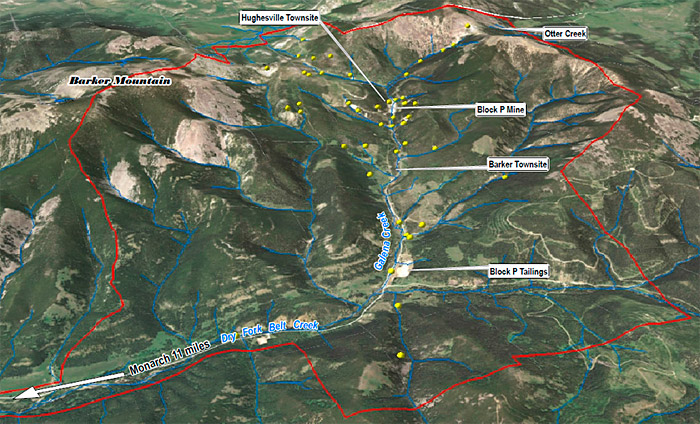
Figure 11‑12. Barker-Hughesville Mining District Site location and layout.

Mining operations typically generate several different types of solid waste, including waste rock, mill tailings, and streamside tailings. These mine wastes often are found to contain elevated levels of several different metals. Excess exposures to these metals are known to cause a range of noncancer and cancer effects in humans, so people who live within or visit the site could be at risk of adverse health effects.

11.11.1.1 Source of the Lead

▼Read more

The two main sources of contamination from former mining activities include (1) deposits of tailings and waste rock that were placed onto soil near the mines or were discharged into nearby streams and (2) discharges of contaminated water from mine adits.

Chemical contaminants in these two main sources of contamination may migrate in the environment by several processes:

  • Fine-grained solid wastes may be released into air by wind erosion and human disturbances.
  • Solid wastes erode into streams, resulting in contamination of both surface water and stream sediments.
  • Contaminants in soils or sediments may be taken up into the tissues of plants or game animals.
  • Contaminants in soils or sediments may be dissolved by water (rain or snowmelt) and enter surface water and may infiltrate into groundwater.
11.11.1.2 Land Use/Exposure Scenarios

▼Read more

The site is rural and mostly forested and is surrounded by rugged mountains with steep slopes ranging in elevation from 4,700 to 8,309 feet. Most of the area is public land in the Lewis and Clark National Forest, administered either by the USFS or the U.S. Bureau of Land Management. Private lands in the Galena Creek watershed are predominantly patented mining claims whose surface mineral rights are privately owned, although there are several structures along Galena Creek in the areas of Barker and Hughesville that are used seasonally by area residents. The Galena Creek watershed is used recreationally in the summer months (mainly between Memorial Day to Labor Day) for a variety of activities, including camping, hiking, horseback-riding, and riding all-terrain vehicles (ATVs). Outside of Monarch, private land available for residences is limited, and it is not expected that future residential development near the site is likely to occur.

USEPA performed an initial evaluation of human health risk at the site in 2010 (USEPA 2010a). The exposure area of principal concern evaluated in this assessment was the Galena Creek watershed and its tributaries, and the populations evaluated included seasonal residents in Barker and Hughesville as well as several types of recreational visitors to the forest and streams of the area. A baseline human health risk assessment (BHHRA) for the site was completed in 2016 (USEPA 2016b).

The receptors selected for evaluation in the BHHRA included:

  • seasonal residents in Barker and Hughesville
  • year-round residents in Monarch
  • hikers, ATV riders, and hunters in the mined and forested areas
  • campers and fishers along area streams

The exposure pathways that were evaluated in the BHHRA for one or more receptors included ingestion of soil, mine waste, and sediment, ingestion of surface water and groundwater as drinking water, inhalation of airborne dust (ATV riders only), and ingestion of locally harvested fish and game (fishers and hunters only).

Numerous samples of soil, mine waste, sediment, surface water, fish tissue, and groundwater have been collected at the Site. There were several metals identified in the BHHRA as chemicals of potential concern (COPCs) for soil and soil-like media (sediment, tailing, other mine waste), surface water, and groundwater. These metals included aluminum, antimony, arsenic, barium, beryllium, cadmium, chromium, cobalt, copper, iron, lead, manganese, mercury, nickel, silver, thallium, vanadium, and zinc.

This case study summarizes the risk characterization approach and results for lead. Table 11-8 presents summary statistics for lead in soil, mine waste, and sediment. As shown, mean lead concentrations were highest in the streamside tailings and sediment, but soils from residential yards were often higher than 400 milligrams per kilogram (mg/kg), which is the default USEPA residential screening level for lead in soil. This screening level assumes a default relative bioavailability (RBA) of lead for soil and soil-like media of 60% (USEPA 2007b).

Table 11‑8. Summary statistics for lead in soil, mine waste, and sediment

Sample Type Samples Mean Concentration (mg/kg) Maximum Concentration (mg/kg)
Monarch residential yards 52 450 1,600
Barker Hughesville residential yards 51 940 5,400
Campsite soils 22 760 6,700
Roadway soils 5 960 1,700
Streamside tailings 180 2,300 35,000
Galena Creek sediment 68 3,900 11,000
Dry Fork Belt Creek sediment 49 1,200 5,400
Belt Creek sediment 11 1,000 1,600

11.11.2 Methodology Used for Evaluating Bioavailability

▼Read more

The incidental ingestion of soil, mine waste, and/or sediment was evaluated for every receptor. When quantifying exposure from ingestion of lead in soil and soil-like media, the risk estimates were adjusted to account for the site-specific relative bioavailability (RBA) of lead.

The RBA of lead was estimated by measuring the amount of lead which solubilized during an in vitro bioaccessibility (IVBA) analysis. This IVBA extraction procedure was performed in accordance with the methods described in USEPA (2007b). There were 17 different soil samples, including residential yard soils, mine waste soil, and roadway soils, evaluated during the lead IVBA analysis.

Table 11-9 presents the soil lead concentrations and resulting lead IVBA values for each individual soil sample. Lead IVBA values were variable, with individual results ranging from 2 to 74% (USEPA 2016b).

Table 11‑9. Lead IVBA and estimated RBA for soils from the Barker-Hughesville Mining District

Sample Type Sample Number Soil Lead Concentration (mg/kg) Lead IVBA (%) Lead RBA (%) Mean Lead RBA (%)
Residential yard soil GL-RY001-NSS-CO1-2 857 31 25 22
RY007NSS-AO1-2 4,619 16 11
RY003-NSS-BO1-2 1,020 45 37
RY012-NSS-AO1-2 973 39 31
RY011-NSS-CO1-2 10,648 12 8
Mine waste pile soil MS001-NSS-BO1-2 5,174 2 <1 23
MS002-NMW-BO1-2 15,064 74 63
MS005-NMW-DO1-2 13,284 5 1
MS005-NMW-B01-2 13,781 30 23
MS003-NMW-DO1-2 23,460 16 11
MS003-NMW-CO1-2 5,656 70 59
MS004-NMW-EO1-2 12,626 12 7
MS004-NMW-BO1-2 29,703 6 2
MS006-NMW-DO1-2 9,680 37 29
MS006-NMW-CO1-2 6,698 59 49
MS001-NSS-DO1-2 9,142 15 10
Roadway soil RD002-NSB-6 2,865 27 21 21

11.11.3 Calculated Bioavailability of Lead in Soils

▼Read more

The correlation between lead IVBA and in vivo RBA is well established (USEPA 2007b). Thus, the lead IVBA results were used to estimate lead RBA values using the following linear equation; in this equation, the IVBA and RBA values are expressed as a fraction, not a percentage:

Table 11-9 presents the estimated lead RBA values for each individual soil sample as well as the mean lead RBA estimate for each soil type (EPA 2016b). Despite the variability in the individual sample RBA results, which ranged from <1% to 63%, the mean RBA values for residential yard soil (22%), mine waste (23%), and roadbed soil (21%) were alike. Because the main source of lead contamination in soils at the site is mine-derived waste material, these RBA values were averaged to yield a single RBA value of 22% that was assumed to be applicable to all soil and soil-like materials. This value is lower than the USEPA default value of 60%, suggesting that lead at the site is in a form that is less readily absorbed.

11.11.4 Application of Bioavailability to Risk Assessment

▼Read more

USEPA recommends the use of toxicokinetic models to correlate blood lead concentrations with exposure and adverse health effects. The IEUBK model is recommended to evaluate exposures from lead-contaminated media in children in a residential setting (USEPA 1994d), and the ALM is recommended to evaluate potential risks from lead exposure in adults (females of child-bearing age) (USEPA 2003b). Both the IEUBK model and the ALM can be used to predict blood lead concentrations in exposed individuals and estimate the probability of a blood lead concentration exceeding a level of potential concern. USEPA has identified a blood lead level of 10 µg/dL as the concentration level at which effects begin to occur that warrant avoidance, and has set a goal that there should be no more than a 5% chance that a child will have a blood lead value above 10 µg/dL (USEPA 1991c; 1994d; 2013c). For convenience, the probability of a blood lead value exceeding 10 µg/dL is referred to as P10.

Both the IEUBK model and ALM require the input of information on the bioavailability of lead for each exposure medium. Bioavailability may be expressed in either absolute terms, as absolute bioavailability (ABA), or in relative terms, as RBA. The ALM employs bioavailability estimates expressed as RBA, whereas the IEUBK model employs bioavailability estimates expressed as ABA. The site-specific ABA for lead can be estimated from RBA using a default absolute absorption fraction of 50%, as follows:

The site-specific soil RBA value of 22% (or ABA value of 11%) was used when predicting potential blood lead levels from site exposures to soil and soil-like media (USEPA 2016b).

11.11.5 How Did Bioavailability Results Affect Site Decisions?

▼Read more

Detailed risk estimates for all COPCs are presented in the BHHRA (USEPA 2016b). Table 11-10 summarizes the estimated lead risks for recreational (Panel A) and residential receptors (Panel B) based on the arithmetic mean exposure point concentrations. The BHHRA also included P10 estimates based on exposure point concentrations calculated as the 95% upper confidence limit on the mean, which resulted in even higher P10 values, but did not change overall conclusions about the exposure populations of potential concern.

Table 11‑10. Summary of lead risks for recreational and residential receptors

Panel A: Recreational Receptors
Population Age Location Exposure Scenarios P10 (%)
Soil-like Water Food >Air All
Hiker Adult Galena Creek/ McKay Gulch a, e 0.5% 1.3% — — 5.8%
ATV rider Adult Galena Creek/ McKay Gulch a,h 3.6% — — <0.1% 5.4%
Hunter Adult Galena Creek/ McKay Gulch a,g <0.1% — <0.1% — <0.1%
Camper Adult Galena Creek b,c,e 0.4% 1.3% — — 5.2%
Adult Dry Fork Belt Creek b,c,e <0.1% <0.1% — — <0.1%
Adult Belt Creek c,e <0.1% <0.1% — — <0.1%
Fisher Adult Galena Creek c,d,f <0.1% <0.1% No data — <0.1%
Adult Dry Fork Belt Creek c,d,f <0.1% <0.1% <0.1% — <0.1%
Adult Belt Creek c,d,f <0.1% <0.1% <0.1% — <0.1%
Panel B: Residential Receptors
Population Age Location Exposure Scenarios P10 (%)
All*
Year-Round Child Monarch i —
j <0.1% – 0.4%
Seasonal Child Barker/Hughesville i <0.1% – 1.7%
j 45% – 60%
*Range across 13 sampled residential properties

Exposure Scenario Key:

a. Incidental ingestion of mine waste
b. Incidental ingestion of streamside tailings/campsite soils
c. Incidental ingestion of steam sediment
d. Incidental ingestion of surface water
e. Ingestion of surface water as drinking water
f. Ingestion of fish
g. Ingestion of game
h. Inhalation of particulates in air
i. Incidental ingestion of yard soil and indoor dust only
j. Incidental ingestion of yard soil and indoor dust plus ingestion of groundwater as drinking water

— = Not evaluated

Risks from lead to hunters and fishers were also within USEPA’s health-based goal (P10 ≤ 5%). P10 values slightly exceeded USEPA’s health-based goal for hikers (5.8%) and ATV riders (5.4%) in the Galena Creek/McKay Gulch area, and for campers along Galena Creek (5.2%). The primary exposure pathway for hikers and campers is the assumed ingestion of lead in water from Galena Creek if creek water was used as a source of drinking water. This pathway is not considered to be especially likely because people hiking and camping in the area generally bring potable drinking water. The primary exposure route for ATV riders is incidental ingestion of mine waste, with a smaller contribution from inhalation exposure.

The lead modeling results showed risks from lead in soil and indoor dust appear to be well below USEPA’s health-based goal (P10 ≤ 5%) for residential children living year-round in the community of Monarch, as well as children living seasonally near Barker and Hughesville. However, if groundwater from wells in the Barker/Hughesville area were used for drinking water in the future (they presently are not used for drinking), risks from lead would be substantial, with P10 values from 45% to 60%.

11.11.6 Regulatory, Community, and Cost Considerations

▼Read more

Although several of the residential properties sampled had mean soil lead concentrations above the default residential soil screening level of 400 mg/kg, when site-specific lead RBA was considered, the resulting lead exposures were predicted to yield blood levels that were below a level of concern. These results suggest lead in residential yard soil is not likely to be an important risk driver for either year-round or seasonal residents.

These results illustrate that site-specific estimates of lead bioavailability can reduce the overall spatial extent and amount of materials that may need to be addressed as part of the site remedial action. Currently, the site feasibility study report and record of decision have not yet been finalized. Site managers still must consider potential exposures to other chemicals of concern, as well as soil and mine waste exposures for lead to hikers and ATV riders in the forested areas and campers along site creeks.

USEPA is in the process of developing site-specific cleanup levels. The derivation of these risk-based cleanup levels for lead in soil and mine waste accounts for the site-specific lead bioavailability as determined from lead IVBA results. Preliminary cleanup levels for lead in soil and mine waste range from about 8,800 to 20,000 mg/kg, depending upon the type of recreational receptor (SRC 2014).

image_pdfPrint this page/section


BCS

web document
glossaryBCS Glossary
referencesBCS References
acronymsBCS Acronyms
ITRC
Contact Us
About ITRC
Visit ITRC
social media iconsClick here to visit ITRC on FacebookClick here to visit ITRC on TwitterClick here to visit ITRC on LinkedInITRC on Social Media
about_itrc
Permission is granted to refer to or quote from this publication with the customary acknowledgment of the source (see suggested citation and disclaimer). This web site is owned by ITRC • 1250 H Street, NW • Suite 850 • Washington, DC 20005 • (202) 266-4933 • Email: [email protected] • Terms of Service, Privacy Policy, and Usage Policy ITRC is sponsored by the Environmental Council of the States.