Appendix C: Site-Specific PAH Methodology, Foster AFB
The following material is adapted from Draft Final PAH Bioavailability Study Report, Former Foster Air Force Base, Skeet Range (USACE 2016) and describes the site-specific methodology used at Foster AFB to determine PAH bioavailability.
The goal of the bioavailability assessment for the former Foster Air Force Base (AFB) was to collect data to develop site-specific relative bioavailability (RBA) values and calculate site-specific protective concentration levels (PCLs) for PAHs in soil under the Texas Risk Reduction Program (TRRP: 30 Texas Administrative Code (TAC) §350.74(j)(1)(C)) and site-specific dermal absorption factors (ABS.d’s) for PAHs in soil under TRRP (30 TAC §350.74(j)(1)(B). Key concepts of TRRP have been incorporated with Comprehensive Environmental Response Compensation and Liability Act (CERCLA) requirements for response actions at the former Foster AFB Skeet Range. These TRRP elements included:
- collection of soil samples from depths which correspond to human and ecological exposures
- performing lateral and vertical delineation to the extent required by TRRP
- defining completed exposure pathways in accordance with the TRRP process
Because there is no state guidance for RBA development for PAHs, Texas Commission of Environmental Quality (TCEQ) representatives were consulted in the development of the methodology, it was also reviewed by the USEPA technical workgroup on bioavailability. The basis of the RBA calculations were the fractional urinary excretions of PAHs: the mass of PAH metabolites in test groups as compared to the mass of PAHs from site soil test articles ingested in diet and the fractional urinary excretion of PAHs from test groups exposed to diet spiked with PAHs extracted from site soil. Chemical characterization of mouse diet prior to feeding and analytical determination of PAH metabolites in mouse urine were used to determine fractional urinary excretion of PAHs. Further details on study design and RBA calculations are provided below; see Figure C-1 for an overview of the bioavailability assessment. See (USACE 2016) for additional information.
Prior to developing the test protocols, five white papers were developed and were reviewed by the TCEQ. The topics addressed by the white papers were as follows:
- animal model
- dose range
- solvent
- pharmacokinetics
- metabolites
- dermal study
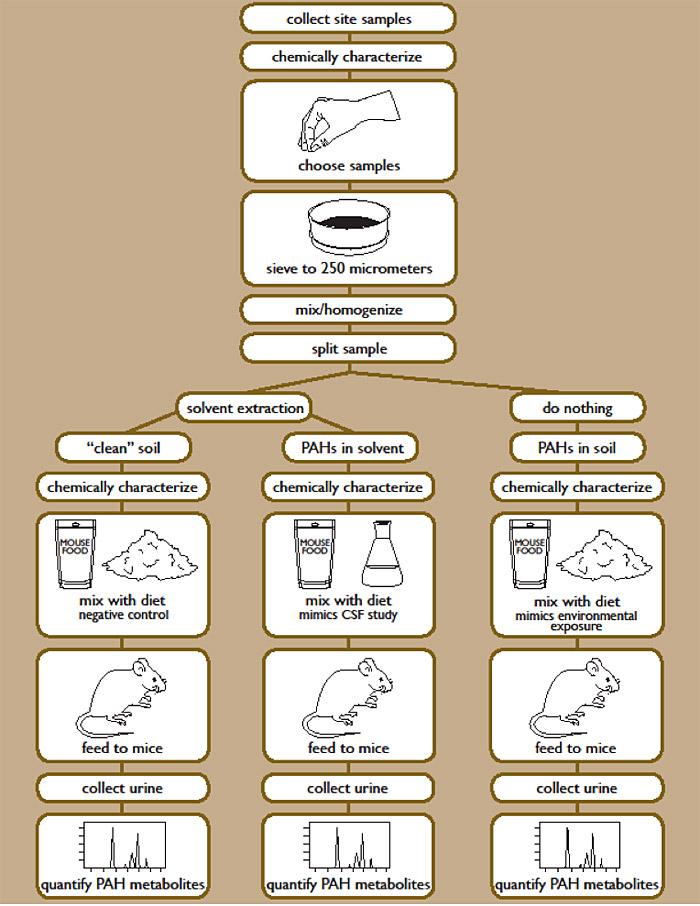
Figure C-1. Overview of bioavailability assessment. (USACE 2016)
The investigation was conducted using two study phases, the Pilot Study and Main Study. The purpose of the Pilot Study was to test the tolerance of B6C3F1 mice to soil in their diet, determine the sensitivity of developed methods to analyze PAH and metabolites in mouse biological fluids, test implementability, and refine procedures for the Main Study. This approach included optimizing preparation of soil test articles, PAH extracts, diet preparation, as well as animal dosing, monitoring, and urine collection and analysis. The Pilot Study included development of an analytical method for an analysis of PAH metabolites in urine.
Bulk soil samples from biased locations having the highest concentrations of PAHs were used in the Pilot Study, as well as clay target fragments obtained at the site. The Main Study included collection of bulk samples from multiple locations providing a range of concentrations for PAHs in soil to evaluate potential dose/response relationships for both oral bioavailability and dermal absorption. By completing the Pilot Study, all components of the investigation plan were tested, and results were used to refine the Investigation Plan for the Main Study.
C.1 Pilot Study
Soil samples were collected from locations with high densities of clay target fragments in soil at the Site to assure high concentrations of PAHs in samples for performance of the Pilot Study. Clay target fragments were also collected from the site to test the PAH source material. The first phase involved testing soil drying and sieving techniques for preparation of soil test articles and soil extracts used in diet preparation for oral bioavailability testing. Oven drying changed the physical state of the clay target fragments and increased concentrations of PAHs in soil immediately surrounding the fragments, thus air drying was used for sample preparation for the study duration. PAH analytical data collected from different size fractions from the sieving study supported the CSM assumption that PAHs in site soil remain in the coal tar pitch/limestone matrix of the target fragments due to mechanical breakdown of the fragments into smaller particles. The CSM assumption was further supported by data for total organic carbon (TOC), whose percentage in soil decreased as soil fraction size decreased.
Soil test articles and pulverized target fragments were prepared in triplicate and analyzed for PAHs of concern. The test articles required several attempts of sieving and homogenization before most PAHs of concern achieved the project RSD goals of 20% as determined using Gy’s Sampling Theory (Pitard 1993). All PAHs analyzed in the soil test articles achieved an RSD below 20%.
The Pilot Study included preparation of a “source material” sample of pulverized clay target fragments. Large clay target fragments were pulverized and subjected to bulk sieving, chemical solvent extraction, diet preparation, and diet analysis in the exact same fashion as the soil test articles.
PAHs were extracted from soil test articles using methylene chloride, blown dry, and resuspended in acetone. Suspension in acetone was performed in an effort to closely duplicate the Beland and Culp study (Beland and Culp 1998) which serves as the basis of current draft slope factor for BaP. The animal species and vehicle for dosing were based upon this study, as it is used as the basis of the oral slope factor developed in the draft toxicological assessment of benzo(a)pyrene (BaP) (USEPA 2013b). Much of the coal tar pitch components fell out of solution when the extracts were shipped to the laboratory for diet preparation and required later revision to the method.
The second phase of the Plot Study was oral bioavailability dosing. The subtasks included diet preparation and animal dosing, monitoring, urine collection and its analysis, these tasks were performed in an animal testing laboratory. Rodent species, B6C3F1 mice, and animal diet, NIH 31 meal, were selected to replicate conditions of Beland and Culp.
Soil test article, fragment test article and extracts were used to prepare Pilot Study diets. Three diets were prepared by varying the amount of soil composition by mass in the diet, soil test articles at 5%, 10%, and 20% soil. These diets were used to determine tolerance of soil in their diet by the B6C3F1 mice. To test the tolerance of clay target in their diet, a diet containing 10% target fragment test article was prepared. Two diets were prepared using extracts, one matched the 10% soil diet and another matched to the 10% fragment target fragment. Precipitation of coal tar residue in the acetone extracts required rinsing the vials 3x with methylene chloride to remove the tar residue. The acetone extract and rinsate were placed on 68 grams of diet and the solvent blown off using nitrogen. Finally, control diets included a negative control composed of 10% clean soil in diet and a positive control composed of 25 ppm of reagent-grade BaP in diet.
A total of eight diet groups were prepared:
- Negative Control Diet – 10% Clean Soil
- Positive Control Diet – 25 ppm Reagent Grade BaP
- 5% Soil Test Article
- 10% Soil Test Article
- 20% Soil Test Article
- Soil Extract Dose Matched to 10% Soil
- 10% Fragment Test Article
- Fragment Extract Dose Matched to 10% Fragments
The diets were analyzed to determine actual concentrations of the 7 target PAHs (see Table C-9). The 25 ppm reagent grade BaP triplicates had an RSD of nearly 50%, with none of the samples near the targeted 25 ppm. It was determined that the diet was spiked with too little volume of BaP in solvent and the diet was prepared again with BaP suspended in a larger volume of solvent, similar to that of the extract diets which showed much more homogeneous results.
Animal dosing, monitoring and urine collection were performed using B6C3F1 mile with four mice per test group, housed together. Mice were housed in Nalgene metabolism cages to allow for collection of 24-hour pooled urine samples, separating food and fecal matter from urine collection vessels to minimize the potential for cross-contamination of PAH metabolites of urine with fecal matter.
Monitoring data collected during the 14-day animal feeding period included: daily body weight, daily diet consumption, and daily general condition of test animals. Urine samples were photographed daily in conical tubes to observe volume and color. Estimates of volume were made from photographs and measurements were made by the analytical laboratory. There was a high degree of uncertainty associated with the estimated urine volumes. (The Main Study protocol has been modified to include quantitative urine volume measurements.) Animals in groups 1 through 6 were dosed for the entire 14-day period. The test animals in Group 8, Fragment Extract diet, demonstrated signs of acute toxicity requiring termination at nine days.
The body weights and food intake rates of Group 1 (Control Diet) and Group 3 (5% Soil Diet) were the same, indicating that 5% soil in diet had no effect on the feeding and growth. Group 4 (10% Soil Diet), Group 5 (20% Soil Diet), and Group 6 (Soil Extract Diet) all had approximately 10% decrease in body weight and between 10% and 20% decrease in food consumption on day 7, with a return to control levels by Day 14. The 10% Fragment Diet (Group 7) and Fragment Extract Diet (Group 8) animals had significant decreases in body weight and food consumption. The mice in Group 8 showed signs of acute toxicity, requiring termination due to their state of health by Day 9. For the fragment and fragment extract groups, body weight was down by 20% and food consumption was half of the Control Diet. Although urine volume data for the Pilot Study were uncertain, it was clear that urine volumes in the Fragment and Fragment Extract were elevated compared to other groups.
Urine PAH Metabolite Method Development Read More
The pilot study included method development for analysis of PAH metabolites in urine. The target PAH metabolites for analysis were determined by the availability of standards for analysis. Standards were identified for three metabolites for BaP including 3OH-BaP, 9OH-BaP, and 7,8-dihydrodiol-BaP (cis/trans). Two other PAHs had standards for metabolites: benz(a)anthracene and chrysene (3OH-benz(a)anthracene and 3OH-chrysene). The metabolites and standards for the isomers of the 7,8-dihydrodiol-BaP metabolites were not sufficiently sensitive to be of use at the concentration found in mouse urine under the exposures presented. The dihydrodiol metabolite, therefore, was removed from the evaluation.
Analysis of the hydroxy-metabolites for PAHs was optimized by including both the Phase I hydroxyl metabolites and the Phase II glucuronides and sulfonates by the deconjugation via enzymatic hydrolysis. In addition, the hydroxyl metabolites, and 3OH-BaP in particular, are readily degraded by photolysis and oxidation. Urine samples were spiked with 2-mercaptoethanol as an anti-oxidant to prevent oxidation and loss of the analytes. Samples were also spiked with a suite of labeled quantification standards and labeled derivatization monitoring standards to improve sensitivity and accuracy.
The method derived for analysis of the select PAH metabolites included the following steps:
1. Obtain 4 mL of Urine Sample
2. Spike with 2-Mercaptoethanol to Prevent Oxidation
3. Add:
a. Quantification Standards
b. De-conjugation Standards
c. β-Glucuronidase Enzyme
4. Incubate at 37oC for 17 hrs
5. Extract 3 Times with 4 mL of Pentane
6. Add:
a. Derivitization Control Standards
b. Recovery Standards
c. Derivitize with N-Methyl-N-(trimethylsilyl) trifluoroacetamide (MSTFA) at 60oC
7. Analyze by High Resolution Gas Chromatography/High Resolution Mass Spectrometry (HRGC/HRMS)
Pilot Study Urine Analysis Read More
Urinary metabolites for PAHs typically represent less than 1% of the administered dose. The addition of an antioxidant to the extraction prevented the oxidation loss of PAH metabolites, principally 3OH-BaP, and enabled detection of the metabolites in the study. Metabolites for all three PAHs were detected in urine from Groups 3 through 8. The concentrations of 3OH-BaP and 9OH-BaP were consistently higher than 3OH-chysene, while concentrations 3OH-benz(a)anthracene were the lowest among the metabolites and consistently an order-of-magnitude below those for the hydroxyl metabolites of BaP. Urinary concentrations of PAH metabolites had little relation to the concentrations of PAHs in the diet due to the variation of amounts of diet ingested and volumes of urine excreted. Calculation of molar mass of PAHs ingested must be compared to molar mass of PAH-metabolites excreted to determine any relationship between concentrations in exposure media and variation in absorption.
Calculation of Pilot Study RBA Read More
Comparisons, the fractional urinary excretion (FUE) were made of the ratio between doses of parent PAH in soil test article ingested by the test animals and the corresponding masses of PAH metabolites in urine. The same comparison was made for the doses and masses in the extract matrix. The RBA is the ratio of these two FUEs. See below for the calculations used for FUE and RBA.
RBAs were developed for target metabolites analyzed in urine. RBAs are calculated for BaP based on both 3OH-BaP and 9OH-BaP metabolites for both the Day-7 and Day-14 sample sets. RBAs were also calculated for benz(a)anthracene and chrysene based on their 3-hydroxy metabolites. RBAs for fragment and fragment extract groups (Group 7 and Group 8) were calculated for Day 7 and Day 9. RBAs were applied to remaining target PAHs as surrogates based on similar chemical and physical parameters.
For each diet test group, the average dose of BaP was calculated from the concentration of BaP in the diet and the amount of diet consumed. The average daily dose was converted to units of micromoles per day (µmol/day) based on the chemical-specific molecular weight. Fractional urinary excretion FUE was calculated as:
FUE = (Mass of BaP metabolites in the 24-hr pooled urine sample at day X)
(Mass of BaP consumed 24 hours prior to urine collection on day X)
The FUE calculations were performed for the animals dosed with the 10% soil test article diet (Group 4) and for animals dosed with soil extract diet (Group 6). These were designated FUEsoil and FUEextract. The same approach was taken for the 10% fragment test article diet (Group 7) and fragment extract diet (Group 8).
The RBA was defined as the ratio of the two FUE metrics.
![]()
The pilot study RBA calculations are summarized in Table C-1.
Table C-1. Pilot study RBA calculation summary for soil samples
| PAH Metabolite | Oral Dose (µmol/day) |
Excreted in Urine (µmol/day) |
FUESoil | FUEextract | RBA | ||
|---|---|---|---|---|---|---|---|
| Soil | Extract | Soil | Extract | ||||
| Day 7 Urine Samples | |||||||
| 3OH-Benzo(a)pyrene | 1.74 | 1.12 | 0.00528 | 0.01129 | 0.00303 | 0.0104 | 0.30 |
| 9OH-Benzo(a)pyrene | 1.74 | 1.12 | 0.00372 | 0.00872 | 0.00214 | 0.00776 | 0.28 |
| 3OH-Benz(a)anthracene | 1.52 | 0.92 | 0.00054 | 0.00088 | 0.00036 | 0.00096 | 0.37 |
| 3OH-Chrysene | 1.90 | 1.3 | 0.00163 | 0.00266 | 0.00086 | 0.00205 | 0.42 |
| Day 14 Urine Samples | |||||||
| 3OH-Benzo(a)pyrene | 1.4 | 1.19 | 0.00447 | 0.01236 | 0.00321 | 0.0104 | 0.31 |
| 9OH-Benzo(a)pyrene | 1.4 | 1.19 | 0.00376 | 0.00949 | 0.00269 | 0.00798 | 0.34 |
| 3OH-Benz(a)anthracene | 1.22 | 0.97 | 0.00044 | 0.00102 | 0.00036 | 0.00105 | 0.35 |
| 3OH-Chrysene | 1.52 | 1.37 | 0.00167 | 0.00263 | 0.00109 | 0.00192 | 0.57 |
The pilot test supports the application of RBAs for soils as follows:
- BaP – Range 28% to 34% with an average of 31%
- Benz(a)anthracene – Range from 35% to 37% with an average of 36%
- Chrysene – Range from 42% to 57% with an average of 50%
Results are summarized in Table C-2.
Table C-2. Pilot study RBA calculation summary for fragment samples
| PAH Metabolite | Oral Dose (µmol/day) |
Excreted in Urine (µmol/day) |
FUEfrag | FUEextract | RBA | ||
|---|---|---|---|---|---|---|---|
| Frag. | Extract | Frag. | Extract | ||||
| Day 7 Urine Samples | |||||||
| 3OH-Benzo(a)pyrene | 4.32 | 3.55 | 0.01647 | 0.04851 | 0.00381 | 0.01365 | 0.28 |
| 9OH-Benzo(a)pyrene | 4.32 | 3.55 | 0.01432 | 0.04355 | 0.00332 | 0.01226 | 0.27 |
| 3OH-Benz(a)anthracene | 4.12 | 3.4 | 0.00125 | 0.00537 | 0.00030 | 0.00158 | 0.19 |
| 3OH-Chrysene | 4.93 | 4.5 | 0.00391 | 0.01098 | 0.00079 | 0.00244 | 0.32 |
| Day 9 Urine Samples | |||||||
| 3OH-Benzo(a)pyrene | 3.34 | 3.24 | 0.01491 | 0.03949 | 0.00446 | 0.01219 | 0.37 |
| 9OH-Benzo(a)pyrene | 3.34 | 3.24 | 0.01144 | 0.03101 | 0.00342 | 0.00957 | 0.36 |
| 3OH-Benz(a)anthracene | 3.19 | 3.10 | 0.00169 | 0.00429 | 0.00053 | 0.00138 | 0.38 |
| 3OH-Chrysene | 3.82 | 4.10 | 0.00393 | 0.01034 | 0.00103 | 0.00252 | 0.41 |
The RBAs for the pulverized target fragments were comparable with concentrations of individual PAHs approximately 5 times the reported soil concentrations. These data indicate that the relative absorption of PAHs in the gastrointestinal tract is not dose dependent at high concentrations. As previously stated, volumes of urine were not recorded as part of the daily record keeping. This factor has led to a high degree of uncertainty in the calculated values for RBA as part of the pilot test. Based on the pilot study, the Main Study protocol has included quantitative record keeping concerning daily urine production.
Conclusions of the Pilot Study Read More
Results of the pilot study identified the following procedures to be included in the protocol for the main study:
- Air-dry bulk soil samples prior to sieving and homogenization.
- Bulk soil samples are to be sieved with a #10 mesh (2 mm) screen, homogenized, then sieved with a #60 mesh (0.25 mm) screen followed by a second homogenization. The two-staged homogenization following sieving was the best method to achieve the target RSD.
- Prepare extracts of soil test articles using methylene chloride and apply directly to diets to keep coal tar pitch in solution.
- Prepare soil diets at 5% soil by mass.
- Collect daily urine volume data.
- Use anti-oxidants to control auto-oxidation of hydroxyl PAH metabolites in urine samples during de-conjugation, extraction, and derivatization steps.
C.2 Main Study
The CSM developed in the Remedial Investigation at the former skeet range was used to determine locations that would represent a range of skeet target fragments. A range of PAH concentrations of three orders of magnitude was planned for the study. This method was used to match site conditions rather than diluting samples with clean soil. Samples were collected from surface soil (0 to 6”) at five different locations, sieved and homogenized as recommended in the pilot study conclusions and analyzed prior to using them as test articles for rodent diet preparation.
Soil test articles were analyzed in triplicate and the target RSD of 20% was met for all but one sample, which was later determined to be due to laboratory error. Each soil test article was divided into two aliquots. One was maintained as soil test article to dose rodent feed and the other was Soxhlet extracted with methylene chloride. The extracts were analyzed in triplicate and all were below 20% RSD. The extracts prepared from the various soil samples were used to prepare diet for dosing B6C3F1 mice.
Diet Preparation Read More
The dietary matrix for the bioavailability assessment used soil and extract test articles (sieved, adherable soil sample and extract) mixed into NIH 31 meal rodent diet. This diet was selected because this diet was used by Beland and Culp (1998). Twelve diets were prepared for testing:
- Diet #1 – Negative Control Diet – based on 5% of the diet by mass made up of “clean” (not impacted by Site operations) soil sieved and prepared in the same manner as the soil test article. The analytical results for PAHs of the clean soil sample were nondetect at sample detection limits ranging from 0.1 mg/kg for benz(a)anthracene to 0.17 mg/kg for chrysene.
- Diet #2 – BaP Positive Control Diet – based on spiking diet with 0.67 mg/kg reagent grade BaP in 107 mL methylene chloride, mixed, and solvent blown down with nitrogen.
- Diet #3 – GS-1 Soil Test Article Diet – based on 5% of diet by mass made up of GS-1 soil test article assuming 4.5 mg/kg BaP in soil test article for a final concentration of 0.22 mg/kg BaP in diet.
- Diet #4 – GS-2 Soil Test Article Diet – based on 5% of diet by mass made up of GS-2 soil test article assuming 183 mg/kg BaP in soil test article for a final concentration of 9.15 mg/kg BaP in diet.
- Diet #5 – GS-3 Soil Test Article Diet – based on 5% of diet by mass made up of GS-3 soil test article assuming 28 mg/kg BaP in soil test article for a final concentration of 1.42 mg/kg BaP in diet.
- Diet #6 – GS-4 Soil Test Article Diet – based on 5% of diet by mass made up of GS-4 soil test article assuming 0.54 mg/kg BaP in soil test article for a final concentration of 0.03 mg/kg BaP in diet.
- Diet #7 – GS-5 Soil Test Article Diet – based on 5% of diet by mass made up of GS-5 soil test article assuming 0.11 mg/kg BaP in soil test article for a final concentration of 0.006 mg/kg BaP in diet.
- Diet #8 – GS-1 Extract Diet – based on matching the concentration of Diet #3 using GS-1 Extract to a target BaP concentration of 0.22 mg/kg.
- Diet #9 – GS-2 Extract Diet – based on matching the concentration of Diet #4 using GS-2 Extract to a target BaP concentration of 9.17 mg/kg.
- Diet #10 – GS-3 Extract Diet – based on matching the concentration of Diet #5 using GS-3 Extract to a target BaP concentration of 1.42 mg/kg.
- Diet #11 – GS-4 Extract Diet – based on matching the concentration of Diet #6 using GS-4 Extract to a target BaP concentration of 0.03 mg/kg.
- Diet #12 – GS-5 Extract Diet – based on matching the concentration of Diet #7 using GS-5 Extract to a target BaP concentration of 0.01 mg/kg.
Diets were developed based on 5% soil test article in diet preparation. Extract-based diets were prepared by matching the dose prepared for the 5% soil test article diet based on concentrations provided by the analytical laboratory. A positive control diet was prepared using reagent grade benzo(a)pyrene (BaP) at a concentration of 25 milligram per kilogram (mg/kg).
Triplicates of prepared diet samples were analyzed for confirmation prior to use in animal testing. Initial analytical results for PAHs in diet varied significantly, causing a change in analytical laboratories. Analytical results from the second laboratory demonstrated a high degree of precision with RSDs well below the 20% goal. In addition, results presented by the second laboratory confirmed the high degree of agreement between calculated concentrations presented in the diet formulations. Confirmed PAH concentrations in test diets allowed the feeding study to begin.
Animal Testing Read More
Fourteen-day animal testing was performed using 12 dose groups (see diet preparation above) of female B6C3FI mice at 4 animals per cage, 2 cages per dose group; 96 mice total. The mice were acclimated to experimental conditions 47 days prior to initiating administration of test diet. Measurements of body weight, feed consumption, urine production, and general animal health were recorded on a daily basis. Pooled urine samples from each of 2 cages per dose group were collected on a daily basis. Mice were exposed to test diets for a total period of 14 days. In-life monitoring data for test animals are summarized in Table C-3.
Table C-3. Main study in-life monitoring average body weight, food consumption, and urine production test animals on days 7 and 14
| Group 1 Control |
Group 3 GS-1 Soil |
Group 4 GS-2 Soil |
Group 5 GS-3 Soil |
Group 6 GS-4 Soil |
Group 7 GS-5 Soil |
|
|---|---|---|---|---|---|---|
| Day 7 | ||||||
| Body Weight (g) | 23.5 | 22.95 | 23.15 | 23.28 | 23.11 | 23.08 |
| Food Intake* (g/day) | 3.5 / 3.5 | 3.2 / 3.9 | 3.4 / 3.4 | 3.4 / 3.6 | 3.5 / 3.8 | 3.6 / 3.6 |
| Urine Prod.** (mL/day) | 20 / 4.6 | 3.4 / 4.0 | 4.8 / 5.5 | 3.5 / 9.6 | 5.1 / 4.0 | 5.1 / 5.2 |
| Day 14 | ||||||
| Body Weight (g) | 24.63 | 24.23 | 24.04 | 24.00 | 23.81 | 24.08 |
| Food Intake* (g/day) | 3.4 / 3.6 | 3.5 / 3.6 | 3.5 / 4.0 | 3.3 / 3.3 | 3.2 / 3.6 | 3.3 / 3.6 |
| Urine Prod.** (mL/day) | 7.3 / 4.5 | 5.8 / 6.5 | 3.9 / 8.0 | 4.3 / 4.6 | 5.5 / 7.0 | 5.4 / 3.8 |
| Group 8 GS-1 Extract |
Group 9 GS-2 Extract |
Group 10 GS-3 Extract |
Group 11 GS-4 Extract |
Group 12 GS-5 Extract |
Group 2 BaP-Spike 25 ppm |
|
| Day 7 | ||||||
| Body Weight (g) | 23.30 | 23.18 | 23.05 | 23.68 | 23.84 | 23.19 |
| Food Intake* (g/day) | 3.3 / 3.2 | 3.4 / 3.2 | 3.5 / 3.1 | 2.8 / 3.6 | 3.5 / 3.6 | 3.7 / 3.2 |
| Urine Prod.** (mL/day) | 5.7 / 5.9 | 4.0 / 5.0 | 5.4 / 3.6 | 4.5 / 5.0 | 6.0 / 5.0 | 5.0 / 5.5 |
| Day 14 | ||||||
| Body Weight (g) | 24.53 | 23.98 | 23.95 | 24.44 | 24.58 | 24.35 |
| Food Intake* (g/day) | 3.3 / 3.4 | 3.1 / 2.9 | 3.3 / 3.2 | 3.2 / 3.1 | 3.5 / 3.3 | 3.3 / 3.3 |
| Urine Prod.** (mL/day) | 7.0 / 7.7 | 4.5 / 4.5 | 6.0 / 5.3 | 3.8 / 3.8 | 4.8 / 4.8 | 1.8 / 4.5 |
* Food intake rate based on the Averages for Days 6/7/8 and Days 13/14/15, Food Intake Cage 1/Food Intake Cage 2
** Urine production based on pooled urine for four mice in Cage 1 / Cage 2
Body weight and food consumption data demonstrated that all dosing groups maintained weight gain and feeding similar to controls indicating that the 5% soil in diet composition achieved the goal of avoiding animal health concerns that might impact data interpretation. Urine data show a high degree of variability, ranging from 1.8 mL to 20 mL with most of the production between 4 and 6 mL per day. Overall health observations of test animals demonstrate that overt toxicity as seen in animals exposed to target fragment extracts in the Pilot Study was not present in the Main Study. Mice were euthanized following completion of the study.
Urine Analyses Read More
Each day 24-hour, pooled urine samples were collected from each test group cage. Urine samples were frozen at -20oC until being shipped to an analytical laboratory following completion of the 14-day dosing period. Clinical inspection of mice indicated that exposure to PAHs in test diets did not result in observable adverse effects to overall animal health.
Based on the precedents set by previous studies of PAH bioavailability and the ease with which mouse urine can be collected and pooled from multiple animals, urinary metabolites were selected as the primary dose metric. The target PAH metabolites for analysis were determined by the availability of standards for analysis of metabolites. Standards were identified for three metabolites for BaP including 3OH-BaP, 9OH-BaP, and 7,8-dihydrodiol-BaP (cis/trans). Two other PAHs had standards for metabolites: Benz(a)anthracene and chrysene (3OH-benz(a)anthracene and 3OH-chrysene). The metabolites and standards for the isomers of the 7,8-dihydrodiol-BaP metabolites were not sufficiently sensitive to be of use at the concentration found in mouse urine under the exposures presented.
The analytical method developed in the Pilot Study Urinary metabolites for PAHs was used to analyze urine. The presence of the antioxidant prevented the oxidative loss of PAH metabolites, principally 3OH-BaP. The results of PAH metabolite analyses in urine samples are summarized in Table C-4, with data for 2 cages represented by cage 1/cage 2.
Table C-4. PAH metabolites in urine samples (µg/L)
| PAH Metabolite | Diet #1 Negative Control |
Diet #2 BaP Control |
Diet #3 GS-1 Soil |
Diet #4 GS-2 Soil |
Diet #5 GS-3 Soil |
Diet #6 GS-4 Soil |
|---|---|---|---|---|---|---|
| Day 7 Urine Samples | ||||||
| 3OH-Benzo(a)pyrene | 0.032U/0.046U | 349 / 335 | 1.62 / 1.61 | 53.5 / 47.5 | 8.69 / 6.14 | 0.451 / 0.558 |
| 9OH-Benzo(a)pyrene | 0.11 / 0.213 | 137 / 176 | 0.973 / 0.9 | 32 / 26.7 | 4.24 / 2.63 | 0.302 / 0.25 |
| 3OH-Benz(a)anthracene | 0.32U / 1.25U | NA | 1.1U/1.6U | 2.18 / 2.79 | 1.2U / 0.88U | 1.08U / 0.7U |
| 3OH-Chrysene | 0.41U / 1.67U | NA | 1.6U/ 2.07U | 42.5 / 42.4 | 8.13 / 5.42 | 1.35U / 0.9U |
| Day 14 Urine Samples | ||||||
| 3OH-Benzo(a)pyrene | 0.073U/0.32U | 1,080 / 596 | 1.82 / 2.43 | 129 / 88.1 | 16.6 / 13.3 | 0.393 / 0.382 |
| 9OH-Benzo(a)pyrene | 0.457/ 0.087U | 261 / 96.8 | 0.219 / 1.11 | 69.9 / 11.5 | 4.21 / 3.87 | 0.07U / 0.061 |
| 3OH-Benz(a)anthracene | 0.93U / 2.17U | NA | 0.55U/0.71U | 3.78 / 2.25 | 1.2U / 1.22U | 0.98U / 1.68U |
| 3OH-Chrysene | 1.21U /3.19U | NA | 0.85 / 0.84 | 50.8 / 30.1 | 11 / 8.19 | 1.3U / 2.14U |
| PAH Metabolite | Diet #7 GS-5 Soil |
Diet #8 GS-1 Extract |
Diet #9 GS-2 Extract |
Diet #10 GS-3 Extract |
Diet #11 GS-4 Extract |
Diet #12 GS-5 Extract |
| Day 7 Urine Samples | ||||||
| 3OH-Benzo(a)pyrene | 0.34U / 0.146 | 4.38 / 4.92 | 488 / 413 | 39.7 / 53.1 | 0.966 / 0.893 | 0.202 / 0.2 |
| 9OH-Benzo(a)pyrene | 0.088U / 0.623 | 2.61 / 2.06 | 161 / 127 | 14.1 / 18.1 | 0.791 / 0.699 | 0.703 / 0.981 |
| 3OH-Benz(a)anthracene | 0.84U /1.6U | 1.72U / 2.26U | 12.4 / 9.17 | 1.33 / 2.07 | 1.52U/ 1.55U | 1.99U / 2.4U |
| 3OH-Chrysene | 1.18U /3.23U | 2.82 / 2.86U | 81.9 / 69 | 23 / 29.4 | 2.61U/ 2.21U | 3.17U / 4.31U |
| Day 14 Urine Samples | ||||||
| 3OH-Benzo(a)pyrene | 0.21U / 0.18U | 5.23 / 3.75 | 535 / 548 | 20.4 / 58.1 | 0.993 / 0.846 | 0.16U / 0.154 |
| 9OH-Benzo(a)pyrene | 0.085 / 0.073 | 2.29 / 1.75 | 226 / 107 | 6.7 / 20.5 | 0.928 / 0.262 | 0.654 / 0.411 |
| 3OH-Benz(a)anthracene | 1.0U /0.304U | 0.88U / 0.44U | 9.76 / 10.1 | 0.96U /2.1U | 0.49U/ 1.55U | 1.19U / 1.12U |
| 3OH-Chrysene | 1.3U /0.388U | 2.51 / 1.68 | 94.5 / 99.4 | 10.1 / 28.8 | 0.62U/ 2.32U | 1.87U / 1.65U |
Bold values represent detected concentrations.
Method development for analysis of PAH metabolites in urine targeted a detection limit of 0.025 µg/L. Matrix interferences in mouse urine increased reporting limits by approximately an order-of-magnitude. The increased reporting limits, specifically for 3OH-BaA and 3OH-Chry, indicate that concentrations of individual PAHs must be above 5 mg/kg in soil to provide sufficient parent compound to detect these metabolites in urine. The analysis of BaP metabolites was more sensitive with consistent detections of metabolites in the urine for soil samples with a BaP concentration of approximately 0.5 mg/kg. The urinary results for PAH metabolites indicate that detectable levels of metabolites are present for chrysene at the 7-day time point. These data were used to develop site-specific RBAs (see below).
RBA and Calculations for Proposed PCL Read More
The data analysis for the pilot and main studies includes calculation of RBAs. No dermal penetration testing was performed as part of the pilot study, so the ABS.d has only been calculated for the main study. In order to calculate the RBAs, a comparison was made of the ratio between doses of parent PAHs ingested by mice and corresponding masses of PAH metabolites in urine for PAHs dosed in the soil matrix. This same comparison was made for the doses and masses of PAHs in the extract (solvent) matrix. The RBA is a ratio of these two values. The ABS.d factor was calculated based on flux estimates using the dermal absorption doses. Once calculated, the PAH-specific RBA and ABS.d values are used to calculate site-specific PCLs. These calculations are summarized below.
Main Study RBA Calculations Read More
RBAs were developed for target metabolites analyzed for in urine. RBAs are calculated for BaP based on both 3OH-BaP and 9OH-BaP metabolites for both the 7-day and 14-day sample sets. Because of the low concentrations of chrysene in sample GS-1 and the lack of detectible metabolite in the urine samples for this group, RBAs could not be calculated for sample GS-1. RBAs were calculated for chrysene based on a data set with 4 data points: GS-2 Day 7, GS-2 Day 14, GS-3 Day 7, and GS-3 Day 14. Because of a similar lack of detectible metabolites, the RBA for benz(a)anthracene was based on two data points: GS-2 Day 7 and GS2- Day14. The low concentrations of 3OH-BaA and 3OH-Chry metabolites are largely related to the relatively low fraction of ingested dose represented by these metabolites. Both benz(a)anthracene and chrysene are present in soil test articles at similar levels compared to BaP. Consistent with literature, 3OH-BaP is a principal metabolite in urine for BaP. RBAs based on 3OH-BaP and 9OH-BaP have a high degree of confidence. These RBAs will be applied to remaining target PAHs as surrogates based on similar chemical and physical parameters.
For each diet test group, the average dose of BaP was calculated from the concentration of BaP in the diet and the amount of diet consumed. The average daily dose was converted in terms of micromoles per day (µmol/day) based on the chemical-specific molecular weight. FUE was calculated as:
FUE = (Mass of BaP metabolites in the 24-hr pooled urine sample at day X)
(Mass of BaP consumed 24 hours prior to urine collection on day X)
The FUE calculations were performed individually for the animals dosed with the soil test article and for corresponding animals dosed with the extract test article diet. These were designated FUEsoil and FUEextract.
The RBA value was defined as the ratio of the two FUE metrics.
![]()
The RBA results are summarized below. RBAs are presented for soil/extract test groups for GS-1, GS-2, and G-3. The concentrations of individual PAHs in these samples range from approximately 5 ppm each to approximately 400 ppm. Soil test articles for GS-4 and GS-5 range from approximately 0.1 ppm to 0.7 ppm with analytical results of metabolites largely at or below reporting limits. The low doses in diets and analytical reporting limits on urinary metabolites lead to erratic RBA calculations. The RBA calculation summaries presented in Table C-5 are based on the Day-14 results of data average between Cage 1 and Cage 2 for each test group.
Table C-5. RBA calculation summary based on day-14 average mass of PAH orally dosed and average mass of PAH metabolites excreted in urine
| Dose (µmol/day) |
Urine (µmol/day) |
FUESoil | FUEextract | RBA | |||
|---|---|---|---|---|---|---|---|
| Soil | Extract | Soil | Extract | ||||
| 3OH-BaP | |||||||
| GS-1 | 0.022 | 0.017 | 0.000041 | 0.00014 | 0.0019 | 0.0082 | 23 |
| GS-2 | 0.96 | 0.53 | 0.0024 | 0.0092 | 0.0025 | 0.017 | 14 |
| GS-3 | 0.14 | 0.12 | 0.00024 | 0.001 | 0.0017 | 0.0088 | 20 |
| 9OH-BaP | |||||||
| GS-1 | 0.022 | 0.017 | 0.000013 | 0.000064 | 0.0006 | 0.0037 | 16 |
| GS-2 | 0.96 | 0.53 | 0.00075 | 0.0028 | 0.00078 | 0.0053 | 15 |
| GS-3 | 0.14 | 0.12 | 0.000073 | 0.00036 | 0.00047 | 0.003 | 16 |
| 3OH-Chry | |||||||
| GS-2 | 1.03 | 0.60 | 0.00094 | 0.0018 | 0.00091 | 0.003 | 30 |
| GS-3 | 0.15 | 0.12 | 0.00017 | 0.00057 | 0.0012 | 0.0047 | 25 |
| 3OH-BaA | |||||||
| GS-2 | 0.92 | 0.55 | 0.00007 | 0.00019 | 0.000076 | 0.00034 | 23 |
The Day-14 RBAs for BaP based on 3OH-BaP and 9OH-BaP metabolites range from 0.15 to 0.23. These results are lower than those reported in the pilot study ranging from 0.28 to 0.34. The pilot test used estimates of urine volume, which has a large impact on the calculation of RBAs; therefore, the main study RBAs, based on measured urine volumes, are more accurate than pilot study RBAs. The RBAs for chrysene based on the Day-14 urine samples range from 0.25 to 0.3. This result is also below the pilot study range of 0.42 to 0.57. Finally, the Day-14 RBA for benz(a)anthracene limited to one measurement based on the GS-2 test group is 0.23. This RBA is below the range reported in the pilot study of 0.35 to 0.37.
The main study results for BaP indicate that RBAs are dose independent. The pilot study data for animals dosed with pulverized target fragments support this conclusion. The Day-7 RBA for pulverized target fragments was 0.28 for 3OH-BaP and 0.27 for 9OH-BaP. Given that there is no dependence of RBA on dose, the bioavailability assessment conservatively supports the application of RBAs as follows:
- BaP – 20%
- Benz(a)anthracene – 23%
- Chrysene – 28%
As previously stated, RBAs for the target PAHs are recommended to be used as surrogates for PAHs not represented in the study. The rationale for this approach is discussed in section C.4
C.3 Methods for In vitro Dermal Penetration Testing
The dermal penetration testing protocol is based on an in vitro approach using Franz Cells and fresh-frozen human skin to model the absorption of PAHs from clay target fragments and soil for systemic distribution and for local site of action in the skin itself. A dermal penetration rate (steady-state flux = mass/skin area/time) was determined for target PAHs and was then used to calculate a dermal absorption factor.
The in vitro method employed in this study has been fully validated against in vivo methods (Federal Register 64 (110) 6/9/99; OECD Guideline for the Testing of Chemicals: Method 428 (adapted 4/13/2004)). The Franz Cell has 2 chambers that can be separated by a membrane, in this case excised human skin as illustrated in Figure C-2.
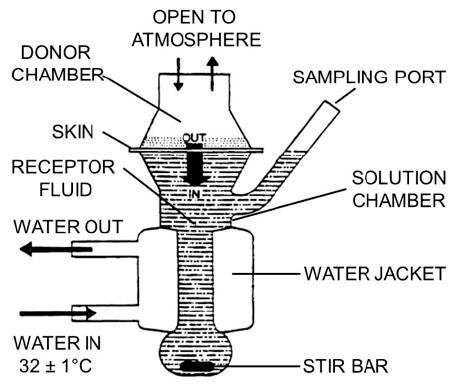
Figure C-2. Franz Diffusion Cell Schematic.
Source: Reprinted with permission from Roy, T. A., A.J. Krueger, B.B. Taylor, D.M. Mauro, and L.S. Goldstein. 1998. Studies estimating the dermal bioavailability of polynuclear aromatic hydrocarbons from manufactured gas plant tar contaminated soils. Environ. Sci. Technol. (1998), 32 (20), 3113−3117. Copyright 1998 American Chemical Society.
Test articles were loaded onto the surface of skin in the donor chamber. The receptor fluid below the systemic surface of the split-skin sample was a saline solution with polyoxyethanol to act as a receiving agent for the lipophilic PAHs. The testing system allows for periodic collection of receptor fluid to monitor diffusion of PAHs across the skin from the test article in the donor chamber. The dermal penetration testing program was performed by Charles River Laboratories.
Seven test groups were included in the dermal investigation with four test article groups and three control groups. The test groups included:
- GS-1 Soil Test Article
- GS-2 Soil Test Article
- GS-3 Soil Test Article
- Pulverized Clay Target Fragments (sieved to 0.25 mm)
- Clean Soil Test Article Spike with 25 ppm BaP
- Corn Oil Spiked with 1 mg/mL BaP
- [C14]-Testosterone in 1% Ethanol Solution
Soil test articles GS-4 and GS-5 were not included in the dermal absorption study due to their low concentrations of PAHs and analytical detection limitations of the methods used with this test. Each test group had five Franz Cells, each with an excised fresh-frozen human skin sample from five different donors. The five donors were both male and female, ages 23 to 65 that had elective surgeries of either abdominal or breast areas. Fresh-frozen human skin was selected for the testing, because it is metabolically inactive while retaining the barrier characteristics of viable skin. The use of fresh-frozen skin, therefore, reduces the complexity of data evaluation.
Split-skin samples in the donor chambers were loaded with 10 milligrams of test articles per square centimeters (mg/cm2). The 10 mg/cm2 loading rate is consistent with a monolayer for soil of 0.05 to 0.25 mm in particle size (USEPA 2007, App. C). Test articles were applied to skin for 24 hours, then washed off. Collection of receptor fluid samples continued an additional 48 hours for a total monitoring period of 72 hours for evaluation of PAH flux across the skin barrier. The data collection was terminated at 72 hours. Excised skin samples tend to breakdown after 48 hours, and the technical project team determined 72 hours was the longest data collection period advisable. After 72 hours, skin samples were stripped five times with tape to remove the stratum corneum from each skin sample. Samples of stratum corneum (tape), dermis, and receptor fluid were extracted and analyzed for PAHs to determine the mass of PAHs in each medium.
Tape, skin, and receptor fluid were extracted and analyzed by high performance liquid chromatography (HPLC) with fluorescence detection. Only 6 of the 7 target PAHs are included in the dermal testing program. Indeno(1,23-cd)pyrene was not included in the suite of PAHs because of a co-elution interference. Since indeno(1,2,3-cd)pyrene is not a risk driver for the Former Foster AFB Skeet Range, the exclusion of indeno(1,2,3-cd)pyrene does not adversely affect the outcome of the dermal absorption investigation.
Evaluation of dermal absorption is based on the individual masses of PAHs in dermis at 72-hours and the sum of masses in receptor fluid samples collected at intermittent time points from 0 to 72 hours. Cumulative masses of PAHs representing systemic absorption is based on reported masses in the dermis at 72 hours and cumulative masses in receptor fluid for all time points.
Dermal Testing Results Read More
Data from the study were normalized to the area of the exposed skin area and were the mass of PAHs from stratum corneum (tape, see above), dermis and receptor fluid. Results are shown in Table C-6. Five of the six target PAHs are represented. Dibenz(a,h)anthracene was detected in only one of the samples collected for receptor fluids, skin, and tape samples near the reporting limit at 0.01 ng/cm2. As a result, dibenzo(a,h)anthracene is not represented in Table C-6.
Doses of BaP, benz(a)anthracene, benzo(b)fluoranthene, and benzo(k)fluoranthene in/on the stratum corneum, dermis, and receptor fluid were closely related to their respective concentrations in the soil and fragment test articles. Concentrations of these PAHs in soil test articles are in the range of 3 to 5 ppm for GS-1, 25 to 30 ppm for GS-3, 200 to 300 ppm for GS-2, and 3,500 to 4,500 ppm for target fragments. The corresponding doses in/on stratum corneum, dermis, and receptor fluid correspond with these concentration ranges for the soil test articles indicating a linear relationship between dermally absorbed doses of these 4 PAHs and soil concentrations. Chrysene was only detected in the receiving fluid near the reporting limit. The chromatographs for chrysene indicated peak interference, which may account for low responses.
Control samples included evaluations of dermal absorption of BaP from a variety of dosing media including 25 ppm BaP-spiked soil, 1,000 ppm BaP-spiked corn oil, and a radio-labeled testosterone sample. The concentration of the soil test article for GS-3 is similar to the BaP-spiked sample. The average absorbed dose in/on the stratum corneum is the same for both the BaP-spiked and the GS-3 test groups; however, the combined average absorbed doses in the dermis and receptor fluid are 5 times higher in the BaP-spiked test group compared to the GS-3 soil test article group. The fragment test article had the highest reported average absorbed doses, but these dose levels were consistent with the concentrations of PAHs in the fragment test articles. The corn oil had a similar absorbed dose level as reported for the fragment test article based on the approximately 1,000 ppm concentration of the PAH in corn oil. Likely, the lipophilic BaP had a relatively low partition rate from the corn oil to the skin.
Table C-6. Summary of PAH doses in stratum corneum, dermis, and receptor fluid over 72 hours (ng/cm2)
| Benzo(a)pyrene | ||||||
|---|---|---|---|---|---|---|
| Stratum corneum | Dermis | Receptor fluid | ||||
| Mean | SD | Mean | SD | Mean | SD | |
| GS-1 | 0.54 | 0.48 | 0.35 | 0.06 | 1.09 | 1.47 |
| GS-2 | 21.5 | 15.6 | 10.9 | 2.85 | 11.4 | 6.71 |
| GS-3 | 2.31 | 2.45 | 1.74 | 0.88 | 2.60 | 1.84 |
| Target Frag | 312 | 178 | 291 | 210 | 76 | 52 |
| BaP Spike | 3.15 | 2.79 | 13.0 | 10.1 | 8.35 | 4.97 |
| BaP Corn Oil | 130 | 105 | 141 | 91 | 51 | 15.1 |
| Benz(a)anthracene | ||||||
| Stratum corneum | Dermis | Receptor fluid | ||||
| Mean | SD | Mean | SD | Mean | SD | |
| GS-1 | 0.41 | 0.19 | 0.32 | 0.00 | 0.82 | 0.86 |
| GS-2 | 15.0 | 11.4 | 5.43 | 1.62 | 11.8 | 6.70 |
| GS-3 | 1.60 | 2.03 | 0.98 | 0.36 | 2.38 | 1.98 |
| Target Frag | 211 | 124 | 188 | 135 | 120 | 79 |
| Benzo(b)fluoranthene | ||||||
| Stratum corneum | Dermis | Receptor fluid | ||||
| Mean | SD | Mean | SD | Mean | SD | |
| GS-1 | 1.65 | 0.14 | 1.59 | 0.00 | 2.74 | 1.58 |
| GS-2 | 31.5 | 22.8 | 15.6 | 4.44 | 17.8 | 10.3 |
| GS-3 | 3.83 | 3.53 | 3.04 | 1.75 | 4.53 | 2.81 |
| Target Frag | 417 | 241 | 405 | 271 | 111 | 74 |
| Benzo(k)fluoranthene | ||||||
| Stratum Corneum | Dermis | Receptor Fluid | ||||
| Mean | SD | Mean | SD | Mean | SD | |
| GS-1 | 0.39 | 0.16 | 0.32 | 0.00 | 0.69 | 0.63 |
| GS-2 | 10.6 | 7.67 | 5.22 | 1.41 | 4.59 | 2.67 |
| GS-3 | 1.26 | 1.25 | 0.90 | 0.51 | 1.01 | 0.61 |
| Target Frag | 141 | 80 | 137 | 95 | 34.1 | 23.1 |
| Chrysene | ||||||
| Stratum Corneum | Dermis | Receptor Fluid | ||||
| Mean | SD | Mean | SD | Mean | SD | |
| GS-1 | 1.59 | 0.00 | 1.59 | 0.00 | 2.03 | 0.02 |
| GS-2 | 1.59 | 0.00 | 1.59 | 0.00 | 2.36 | 0.24 |
| GS-3 | 1.59 | 0.00 | 1.59 | 0.00 | 2.07 | 0.04 |
| Target Frag | 1.59 | 0.00 | 1.59 | 0.00 | 5.35 | 2.47 |
The flux of PAHs across the skin barrier is the metric used to calculate the ABS.d factor. Flux introduces a time component into the dose and is expressed in units of ng/cm2/hr. Table C-7 provides a summary of flux rates and detection frequencies (lower limit of detection [LLOD]) for BaP, benz(a)anthracene, benzo(b)fluoranthene, benzo(k)fluoranthene, and chrysene. As demonstrated in Table C-7, the average flux estimates for PAHs associated with soil test article GS-1 are based on limited numbers of detected sample results with only 3% of samples having detectable concentrations for benzo(a)anthracene and benzo(a)pyrene, and only 7% detection frequency reported for benzo(b)fluoranthene. Both benzo(k)fluoranthene and chrysene had no detectable sample results. As a result, the dermal absorption test group for soil test article GS-1 is likely to overestimate potential flux.
Table C-7. Average flux rates for PAHs from soil test articles, fragments, and controls
| 24 Hour Average Flux Rate to Receptor Fluids | ||||||||||
|---|---|---|---|---|---|---|---|---|---|---|
| Benz(a) anthracene |
Benzo(a) pyrene |
Benzo(b) Fluoranthene |
Benzo(k) fluoranthene |
Chrysene | ||||||
| ng/cm2 /h |
% > LLOQ |
ng/cm2 /h |
% > LLOQ |
ng/cm2 /h |
% > LLOQ |
ng/cm2 /h |
% > LLOQ |
ng/cm2 /h |
% > LLOQ |
|
| GS-1 | 0.003 | 3 | 0.003 | 3 | 0.036 | 7 | 0.001 | 0 | 0.00 | 0 |
| GS-3 | 0.028 | 20 | 0.018 | 10 | 0.013 | 0 | 0.003 | 0 | 0.00 | 0 |
| GS-2 | 0.1 | 33 | 0.062 | 27 | 0.1 | 13 | 0.021 | 17 | 0.031 | 3 |
| Target
Frag |
1.5 | 53 | 0.14 | 27 | 0.97 | 40 | 0.26 | 40 | 0.93 | 47 |
| BaP
Spike |
– | – | 0.56 | 40 | – | – | – | – | – | – |
| BaP Oil | – | – | 0.43 | 47 | – | – | – | – | – | – |
The large numbers of samples with nondetected concentrations of PAHs is largely related to the relatively long breakthrough period required to see PAHs on the skin penetrate through the skin into the receptor fluid. Consistent among all testing groups, PAHs are not present in the first five sample collection points from time 0 to 8 hours. At 16 hours, PAHs were detected in the receiving fluid. In test articles with lower concentrations of PAHs, these compounds are generally not detected in the receptor fluid.
C.4 RBA, ABS.d and PCL Calculations
The data analysis for the pilot and main studies includes calculation of RBAs. No dermal penetration testing was performed as part of the pilot study, so the ABS.d has only been calculated for the main study. In order to calculate the RBAs, a comparison was made of the ratio between doses of parent PAHs ingested by mice and corresponding masses of PAH metabolites in urine for PAHs dosed in the soil matrix. This same comparison was made for the doses and masses of PAHs in the extract (solvent) matrix. The RBA is a ratio of these two values. The ABS.d factor was calculated based on flux estimates using the dermal absorption doses presented in Section 6. Once calculated, the PAH-specific RBA and ABS.d values are used to calculate site-specific PCLs. These calculations are summarized below.
RBA Calculations Read More
RBAs were developed for target metabolites analyzed for in urine. RBAs are calculated for BaP based on both 3OH-BaP and 9OH-BaP metabolites for both the 7-day and 14-day sample sets. Because of the low concentrations of chrysene in sample GS-1 and the lack of detectible metabolite in the urine samples for this group, RBAs could not be calculated for sample GS-1. RBAs were calculated for chrysene based on a data set with 4 data points: GS-2 Day 7, GS-2 Day 14, GS-3 Day 7, and GS-3 Day 14. Because of a similar lack of detectible metabolites, the RBA for benz(a)anthracene was based on two data points: GS-2 Day 7 and GS2- Day14. The low concentrations of 3OH-BaA and 3OH-Chry metabolites are largely related to the relatively low fraction of ingested dose represented by these metabolites. Both benz(a)anthracene and chrysene are present in soil test articles at similar levels compared to BaP. Consistent with literature, 3OH-BaP is a principal metabolite in urine for BaP. RBAs based on 3OH-BaP and 9OH-BaP have a high degree of confidence. These RBAs will be applied to remaining target PAHs as surrogates based on similar chemical and physical parameters.
For each diet test group, the average dose of BaP was calculated from the concentration of BaP in the diet and the amount of diet consumed. The average daily dose was converted in terms of micromoles per day (µmol/day) based on the chemical-specific molecular weight. FUE was calculated as described in the Pilot Test section for the animals dosed with the soil test article and for corresponding animals dosed with the extract test article diet. These were designated FUEsoil and FUEextract.
The RBA was defined as the ratio of the two FUE metrics.
![]()
The RBA results are summarized in Table C-8. RBAs are presented for soil/extract test groups for GS-1, GS-2, and G-3. The concentrations of individual PAHs in these samples range from approximately 5 ppm each to approximately 400 ppm. Soil test articles for GS-4 and GS-5 range from approximately 0.1 ppm to 0.7 ppm with analytical results of metabolites largely at or below reporting limits. The low doses in diets and analytical reporting limits on urinary metabolites lead to erratic RBA calculations. The RBA calculation summaries presented below are based on the Day-14 results of data average between Cage 1 and Cage 2 for each test group.
Table C-8. RBA calculation summary based on day-14 average mass of PAH orally dosed and average mass of PAH metabolites excreted in urine
| Dose (µmol/day) |
Urine (µmol/day) |
FUESoil | FUEextract | RBA | |||
|---|---|---|---|---|---|---|---|
| Soil | Extract | Soil | Extract | ||||
| 3OH-BaP | |||||||
| GS-1 | 0.022 | 0.017 | 0.000041 | 0.00014 | 0.0019 | 0.0082 | 23 |
| GS-2 | 0.96 | 0.53 | 0.0024 | 0.0092 | 0.0025 | 0.017 | 14 |
| GS-3 | 0.14 | 0.12 | 0.00024 | 0.001 | 0.0017 | 0.0088 | 20 |
| 9OH-BaP | |||||||
| GS-1 | 0.022 | 0.017 | 0.000013 | 0.000064 | 0.0006 | 0.0037 | 16 |
| GS-2 | 0.96 | 0.53 | 0.00075 | 0.0028 | 0.00078 | 0.0053 | 15 |
| GS-3 | 0.14 | 0.12 | 0.000073 | 0.00036 | 0.00047 | 0.003 | 16 |
| 3OH-Chry | |||||||
| GS-2 | 1.03 | 0.60 | 0.00094 | 0.0018 | 0.00091 | 0.003 | 30 |
| GS-3 | 0.15 | 0.12 | 0.00017 | 0.00057 | 0.0012 | 0.0047 | 25 |
| 3OH-BaA | |||||||
| GS-2 | 0.92 | 0.55 | 0.00007 | 0.00019 | 0.000076 | 0.00034 | 23 |
The main study results for BaP indicate that RBAs are dose independent. The pilot study data for animals dosed with pulverized target fragments support this conclusion. As presented in Appendix D, the Day-7 RBA for pulverized target fragments was 0.28 for 3OH-BaP and 0.27 for 9OH-BaP. Given that there is no dependence of RBA on dose, the PAH bioavailability assessment conservatively supports the application of RBAs as follows:
The Day-14 RBAs for BaP based on 3OH-BaP and 9OH-BaP metabolites range from 0.15 to 0.23. These results are lower than those reported in the pilot study ranging from 0.28 to 0.34. The pilot test used estimates of urine volume, which has a large impact on the calculation of RBAs; therefore, the main study RBAs, based on measured urine volumes, are more accurate than pilot study RBAs. The RBAs for chrysene based on the Day-14 urine samples range from 0.25 to 0.3. This result is also below the pilot study range of 0.42 to 0.57. Finally, the Day-14 RBA for benz(a)anthracene limited to one measurement based on the GS-2 test group is 0.23. This RBA is below the range reported in the pilot study of 0.35 to 0.37.
- BaP – 20%
- Benz(a)anthracene – 23%
- Chrysene – 28%
As previously stated, RBAs for the target PAHs are recommended as surrogates for PAHs not represented in the study. Table C-9 summarizes the physical and chemical characteristics of the seven carcinogenic PAHs.
Table C-9. Chemical and physical properties of PAHs
| COC | Number Aromatic Rings | Molecular Weight | Log Kow |
|---|---|---|---|
| Benzo(a)pyrene | 5 | 252 | 6.11 |
| Benzo(b)fluranthene | 5 | 252 | 6.11 |
| Benzo(k)fluoranthene | 5 | 252 | 6.11 |
| Dibenz(a,h)anthracene | 5 | 278 | 6.70 |
| Indeno(1,2,3-cd)pyrene | 6 | 276 | 6.70 |
| Benz(a)anthracene | 4 | 228 | 5.52 |
| Chrysene | 4 | 228 | 5.52 |
Based on physical structure (number of aromatic rings and molecular weight) and chemical properties (Log Kow), BaP represents an appropriate surrogate for benz(b)fluoranthene, benzo(k)fluoranthene, indeno(1,2,3-cd)pyrene, and dibenz(a,h)anthracene. BaP has the same molecular weight as benzo(b)fluoranthene and benzo(k)fluoranthene. The molecular weights of dibenzo(a,h)anthracene (278) and indeno(1,2,3-cd)pyrene (276) are higher than BaP (252), but much higher than the molecular weights of benz(a)anthracene (228) and chrysene (228). BaP has a 5-ring structure same as benzo(b)fluoranthene, benzo(k)fluoranthene, and dibenz(a,h)anthracene. Indeno(1,2,3-cd)pyrene has a 6-ring structure. Benz(a)anthracene and chrysene have 4-ring structures. Based on these differences in physical properties, the solubility of benzo(b)fluoranthene, benzo(k)fluoranthene, dibenz(a,h)anthracene, and indeno(1,2,3-cd)pyrene are similar to BaP, which are lower than the reported solubility for benz(a)anthracene and chrysene as evidenced by lower water partitioning coefficients (Log Kow). The RBAs for benz(a)anthracene and chrysene are based on their own analyses. These site-specific RBA values are recommended for calculation of site-specific Tier 2 PCLs for PAHs in soil based on direct contact (TotSoilComb).
ABS.d Calculation Read More
Dermal penetration testing for PAHs in target fragments and soil from the site demonstrated a decreased dermal absorption of PAHs in the clay target matrix compared to PAHs dosed in either spiked soil or corn oil. The data produced in the dermal penetration testing is presented in Table C-10 in terms of absorbed dose in units of ng/cm2. Dermal absorption is based on flux, which introduces a temporal component to the calculation (ng/cm2/hr). The calculation of ABS.d is based on the following:
1) Calculation of Experimental Absorption Factor (ABSExp; picograms per centimeter [pg/cm2])
![]()
where:
FR = Flux Rate to Receptor Fluid (pg/cm2/hr)
ET = Exposure Time (hr)
ABSs = Absorbed Dose in Skin (pg/cm2)
2) Calculation of Adjusted Absorption Factor (ABSAdj; pg/cm2)
![]()
where:
FSLR = Field Soil Loading Rate (0.2 mg/cm2)
ESLR = Experimental Soil Loading Rate (10 mg/cm2)
3) Calculation of ABS.d (unitless)
![]()
where:
C = Concentration of Benzo(a)pyrene in Test Article (ng/mg)
CF = Conversion Factor (pg/ng)
The ABSAdj calculation corrects the absorption fraction to account for the application of the 10 mg/cm2 monolayer in the dermal penetration testing protocol. Just as the RBA calculations were dominated by several factors including concentrations of PAHs and PAH-metabolites in urine, food ingestion rates, and daily urine volumes, ABS.d is heavily influenced by the reported soil concentration. As discussed above, analytical results for soil test articles had difficulty achieving the project-specific target RSD of 20%, which could be due to sample inhomogeneity or imprecision in the PAH analytical method. Given that diets were prepared, analyzed, and demonstrated to meet the RSD requirements, the high RSDs in the analytical results for the soil test articles were not due to inhomogeneity of the soil samples. They were due to imprecision of the analytical method. These analytical uncertainties did not impact interpretation of oral bioavailability data, because the oral RBAs are all based on direct measurements of PAH concentrations in diet. To minimize uncertainties in the ABS.d calculations, the soil concentration data were not used. Instead, the ABS.d calculation is based on concentrations of PAHs in the 5% Diets times 20 as a more representative PAH concentration in soil due to much lower RSDs in the analytical database when those analyses were performed by a different laboratory.
Table C-10. ABS.d calculation summary based on cumulative 24-hour and 72-hour receptor fluid results and dermis concentrations at 72-hours
| Average Flux Rate to Receptor Fluid | Average ABS.d Based on Receptor Fluid |
Average ABS.d Based on Receptor Fluid and Dermis |
||||||
|---|---|---|---|---|---|---|---|---|
| 24-hr | 72-hr | 24-h | 72-h | 24-h | 72-h | |||
| ng/cm2/h | % > LLOQ | ng/cm2/h | % > LLOQ | % | % | % | % | |
| Benzo(a)pyrene | ||||||||
| GS-1 | 0.003 | 3 | 0.011 | 10 | 0.09 | 0.35 | 0.37 | 1.3 |
| GS-3 | 0.018 | 10 | 0.03 | 38 | 0.08 | 0.16 | 0.43 | 0.83 |
| GS-2 | 0.062 | 27 | 0.16 | 56 | 0.04 | 0.10 | 0.32 | 0.58 |
| BaP Spike | 0.14 | 27 | 0.12 | 56 | 1.3 | 1.11 | 6.6 | 8.5 |
| Target Frag | 0.56 | 40 | 1.1 | 63 | 0.03 | 0.06 | 0.71 | 0.86 |
| BaP Oil | 0.43 | 47 | 0.71 | 68 | 0.10 | 0.17 | 1.5 | 1.9 |
| Benz(a)anthracene | ||||||||
| GS-1 | 0.003 | 3 | 0.010 | 18 | 0.11 | 0.38 | 0.38 | 1.4 |
| GS-3 | 0.028 | 20 | 0.03 | 46 | 0.15 | 0.18 | 0.40 | 0.81 |
| GS-2 | 0.1 | 33 | 0.2 | 60 | 0.08 | 0.12 | 0.24 | 0.52 |
| Target Frag | 1.5 | 53 | 1.7 | 71 | 0.10 | 0.11 | 0.62 | 0.85 |
| Benzo(b)fluoranthene | ||||||||
| GS-1 | 0.036 | 7 | 0.026 | 8 | 1.18 | 0.84 | 2.27 | 3.6 |
| GS-3 | 0.013 | 0 | 0.05 | 24 | 0.06 | 0.26 | 0.67 | 1.38 |
| GS-2 | 0.1 | 13 | 0.2 | 46 | 0.07 | 0.15 | 0.47 | 0.85 |
| Target Frag | 0.97 | 40 | 1.6 | 63 | 0.05 | 0.08 | 0.87 | 1.05 |
| Benzo(k)fluoranthene | ||||||||
| GS-1 | 0.001 | 0 | 0.005 | 4 | 0.05 | 0.18 | 0.29 | 0.8 |
| GS-3 | 0.003 | 0 | 0.01 | 28 | 0.02 | 0.07 | 0.23 | 0.42 |
| GS-2 | 0.021 | 17 | 0.063 | 48 | 0.01 | 0.04 | 0.16 | 0.28 |
| Target Frag | 0.26 | 40 | 0.5 | 63 | 0.04 | 0.08 | 1.02 | 1.22 |
| Chrysene | ||||||||
| GS-1 | 0.000 | 0 | 0.000 | 0 | 0.00 | 0.00 | 1.19 | 1.2 |
| GS-3 | 0.000 | 0 | 0.02 | 8 | 0.00 | 0.10 | 0.17 | 0.46 |
| GS-2 | 0.031 | 3 | 0.024 | 16 | 0.02 | 0.02 | 0.04 | 0.07 |
| Target Frag | 0.93 | 47 | 0.1 | 45 | 0.05 | 0.00 | 0.05 | 0.01 |
| Dibenzo(a,h)anthracene | ||||||||
| GS-1 | 0.008 | 0 | 0.003 | 0 | 2.02 | 0.74 | 5.54 | 5.7 |
| GS-3 | 0.008 | 0 | 0.003 | 0 | 0.35 | 0.13 | 0.94 | 0.98 |
| GS-2 | 0.008 | 0 | 0.003 | 0 | 0.05 | 0.02 | 0.14 | 0.15 |
| Target Frag | 0.01 | 0 | 0.0 | 0 | 0.00 | 0.00 | 0.01 | 0.01 |
The calculated ABS.ds do not include the PAHs retained in or on the stratum corneum. The PAHs bound in the stratum corneum or on the surface of the stratum corneum are assumed to be unavailable for penetration to dermis and systemic compartment because the skin sloughs at high frequency. This assumption was supported by the data collected of PAH doses in stratum corneum, dermis and receptor fluid over 72 hours. Concentrations of BaP in the GS-3 and BaP Spike samples were closely related at 28 ppm and 25 ppm, respectively. The corresponding doses of BaP in/on the stratum corneum for GS-3 and the BaP Spike samples were also closely related at 2.31 ng/cm2 and 3.15 ng/cm2, respectively. The dermis doses and receptor fluid doses, however, were very different for GS-3 (BaP in soil test article at approximately 28 ppm) and BaP Spike (reagent grade BaP spiked in clean soil at 25 ppm). The dermis dose for GS-3 was 1.74 ng/cm2 compared to 13 ng/cm2 for BaP Spike, and the receptor fluid dose for GS-3 was 2.6 ng/cm2 compared to 8.35 ng/cm2 for BaP Spike. The dose of BaP penetrating dermis and systemic compartments in the BaP Spike sample was 5 times greater than the dose reported for GS-3. Since the stratum corneum had similar doses in these two samples 48 hours after the termination of the exposure regardless of the dose of PAHs moving through the dermis to the receptor fluid, the residual dose from the tape strip samples is unavailable for absorption.
Evaluation of dermal penetration is focused on results for soil test articles GS-2 and GS-3. Concentrations of PAHs in soil test article GS-1 was too low to see reportable concentrations of PAHs in receptors fluid as demonstrated in Table C-11 (see PCL Calculation section). The percentages of receptor fluid samples with detectable concentrations of PAHs ranged from 0% to 18%. The high frequency of nondetected results for the GS-1 soil test article means that the calculated ABS.d values are based on the sample-specific reporting limits rather than mass of PAH penetrating the dermal barrier. As a result, ABS.d values are based on the results for the GS-2 and GS-3 soil test articles
The relative changes in the ABS.d values are proportional to the relative differences in the soil concentrations used in the calculations. In general, the analytical data presented by diet analytical has a higher degree of confidence, because their analytical results confirmed dose preparations by the animal laboratory. The recommended ABS.d values for the target PAHs, therefore, are based on the average of the GS-2 and GS-3 ABS.d values for the data set using the back calculated soil concentrations from the diet analyses as follows:
PCL Calculation Read More
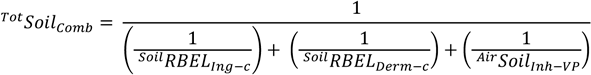
Calculations for the PCLs proposed to TCEQ were performed based on the equations, factors, and assumptions presented in the TRRP rule (30 TAC §350, Subchapter D). The critical PCLs for PAHs in soil at the Former Foster AFB are based on direct contact by commercial/industrial receptors, which are evaluated using the TotSoilComb PCL. The TotSoilComb PCL calculations for PAHs have three Risk-based Exposure Limit (RBEL) pathways including:
1) Dermal contact with carcinogenic COCs (SoilRBELDerm-c) as described in 30 TAC §350.74(c).
![]()
where:
RL – Risk Level – 10-5
BW.A – Body Weight – adult – 70 kg
ATc – Averaging Time – carcinogens – 70 years
SF – Cancer Potency Slope Factor – chemical specific (mg/kg-day)-1
MF – Modifying Factor – 1 for PAHs
ED.w – Exposure Duration – worker – 25 years
EF.w – Exposure Frequency – worker – 250 days
SA.w – Skin Surface Area – worker – 2,500 cm2
AF.w – Soil-to-Skin Adherence Factor – worker – 0.2 mg/cm2-event
ABS.d – Dermal Absorption Factor – chemical specific
2) Ingestion of carcinogenic COCs in soil (SoilRBELIng-c) as described in 30 TAC §350.74(d).
![]()
where:
IRsoil.w – Soil Ingestion Rate – worker – mg/day
RBA – Relative Bioavailability – chemical specific
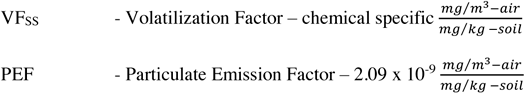
3) Inhalation of carcinogenic COCs from air (AirRBELInh-VP) as described in 30 TAC §350.74(d).
![]()
where:
URF – Unit Risk Factor – chemical-specific (µg/m3)
The proposed PCL for the inhalation of COC vapors or adsorbed to fugitive dusts is calculated based on the PCL calculations described in 30 TAC §350.75(b)(1).
![]()
where:
The RBELs can be recalculated using site-specific RBA as described in 30 TAC §350.74(j)(1)(C) and dermal absorption factors (ABS.d) as described in 30 TAC §350.74(j)(1)(B). Ingestion RBEL and dermal contact REBL are equivalent to their respective PCLs. The TotSoilComb PCL, therefore, is calculated using the equation presented in 30 TAC §350.75(b)(1):
Based on the equations, factors, and assumptions presented in the TRRP rule, site-specific PCLs can be calculated by adjusting the RBAs for PAHs as previously described and ABS.d values to determine the potential impact of applying site-specific dermal absorption values. A summary of potential site-specific TotSoilComb proposed PCLs for PAHs at the Former Foster AFB is presented below, also presented in the table are default TRRP TotSoilComb values with no adjustments made for bioavailability or dermal absorption.
Table C-11 summarizes the results.
Table C-11. Summary of TotSoilComb Proposed PCLs for PAHs at the former Foster AFB (mg/kg)
| COC | Slope factor | RBA | ABS.d | Proposed Tier 2 CommercialTotSoilComb |
TRRP Tier 1 Commercial PCL TotSoilComb |
|---|---|---|---|---|---|
| Benz(a)anthracene | 0.73 | 0.23 | 0.007 | 141 | 24 |
| Benzo(a)pyrene | 7.3 | 0.2 | 0.007 | 16.3 | 2.4 |
| Benzo(b)fluoranthene | 0.73 | 0.2 | 0.011 | 149 | 24 |
| Benzo(k)fluoranthene | 0.073 | 0.2 | 0.0035 | 1,780 | 240 |
| Chrysene | 0.0073 | 0.28 | 0.0026 | 13,000 | 2400 |
| Dibenz(a,h)anthracene | 7.3 | 0.2 | 0.0057 | 17.0 | 2.4 |
| Indeno(1,2,3-cd)pyrene | 0.73 | 0.2 | 0.011 | 153 | 24 |
The slope factors shown in Table C-11 were those that were available in USEPA’s Integrated Risk Information System at the time the Former Foster AFB report was prepared. However, in January 2017, USEPA (2017f) updated the slope factor for BaP and since the other PAH’s potency is set relative to this chemical all of the other PCLs shown above were revised by TCEQ and published on their TRRP website. The Tier 1 values have been raised by a factor of ~7 due to the slope factor revisions, the proposed Tier 2 values change by the same factor. Impacts on remediation at the site have not yet been determined and would be documented in the next project phase, the Proposed Plan.
C.5 Lessons Learned from the Bioavailability Assessment
Based on the results of the PAH Bioavailability Assessment for the Former Foster AFB site, the following conclusions and lessons learned have been made:
- Reproducible soil test articles can be reliably prepared from bulk soil samples through soil sample sieving and mixing procedures developed in these studies.
- Diets prepared from soil test articles and extracts can be reliably prepared controlling the dose of environmental contaminants delivered to test animals for the purpose of evaluating bioavailability using procedures in this study.
- Analytical methodology to quantify the concentrations of urinary PAH metabolites have sufficient sensitivity to evaluate oral bioavailability soil samples impacted with PAHs down to approximately 1 mg/kg based on BaP concentrations and 10 mg/kg for chrysene and benz(a)anthracene concentrations.
- RBA values based on FUE calculations have provided consistent results between samples and studies in the literature. They were confirmed as sufficiently conservative using Casteel’s method of regression analysis which compared mean slopes of the line of 3-OH excretion rate vs the mean dose rate for test articles and compared it to the slope of the line for the control group.
- Dermal penetration testing has sufficient sensitivity to evaluate ABS.d from soil samples impacted with PAHs down to approximately 10 mg/kg (below 10 mg/kg LLODs will dictate ABS.d with ABS.ds increasing as concentrations of PAH further decrease).
- Proposed site-specific PCLs for PAHs increase by approximately a factor of 2 above the published TRRP Tier 1 PCLs based solely on application of site-specific RBA values.
- Proposed site-specific PCLs for PAHs increase as much as by a factor of 6 times above published TRRP Tier 1 PCLs based on both site-specific RBA values and potential ABS.d.
- Uncertainties exist for the following as noted in comments received from the USEPA and are the subject of ongoing collaborative studies between the USACE and the University of Florida:
- Whether enzyme induction from exposure to PAHs plays a role in amount of PAH metabolite formation, study will include analysis of mouse urine from a shorter term of exposure, day 1 or 2.
- Impact of Nalgene cages on recovery of PAHs in mouse urine.
- Impact of feces falling into urine prior to collection.

